
Note
Go to the end to download the full example code or to run this example in your browser via JupyterLite.
Richardson’s relaxation: iterating toward Laplace’s solution#
Lewis Fry Richardson (1911) replaced Laplace’s equation by finite
differences and solved the resulting equations by hand, sweeping over
the grid and replacing each value by the average of its neighbors until
nothing changed. That idea became the Jacobi iteration; updating values
in place gives Gauss-Seidel, and over-relaxing each update gives SOR
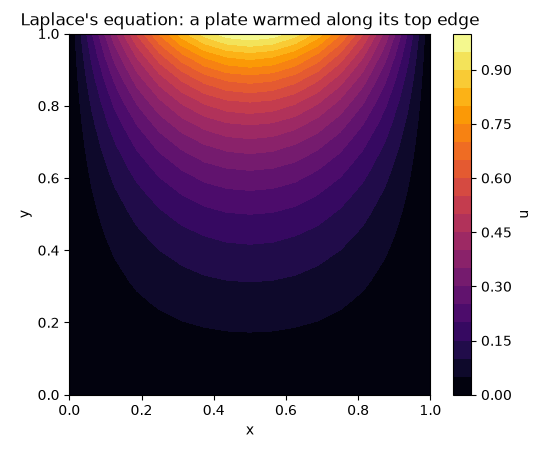
(Young, 1950). This script heats one side of a square plate and compares
how fast the three relaxation schemes from mathematicskit.linalg,
and conjugate gradient, converge.
import matplotlib.pyplot as plt
import numpy as np

from mathematicskit.linalg.visualizers import plot_residual_history
from mathematicskit.pde import solve_laplace_2d
from mathematicskit.pde.visualizers import plot_field_2d

n = 17
boundary = np.zeros((n, n))
boundary[:, -1] = np.sin(np.pi * np.linspace(0.0, 1.0, n))  # warm top edge
The steady temperature#
Relaxation sweeps#
fig2, ax2 = plt.subplots(figsize=(7, 4.5))
for method in ("jacobi", "gauss_seidel", "sor", "cg"):
    sol = solve_laplace_2d(boundary, n=(n, n), method=method, tol=1e-8)
    result = sol.solver_result
    print(f"{method:>12}: {result.iterations:5d} iterations, max |u - direct| = {np.max(np.abs(sol.u - direct.u)):.1e}")
    plot_residual_history(result, ax=ax2, label=method)
ax2.set_xscale("log")
ax2.set_title("Jacobi (Richardson) < Gauss-Seidel < SOR < CG")
fig2.tight_layout()

plt.show()
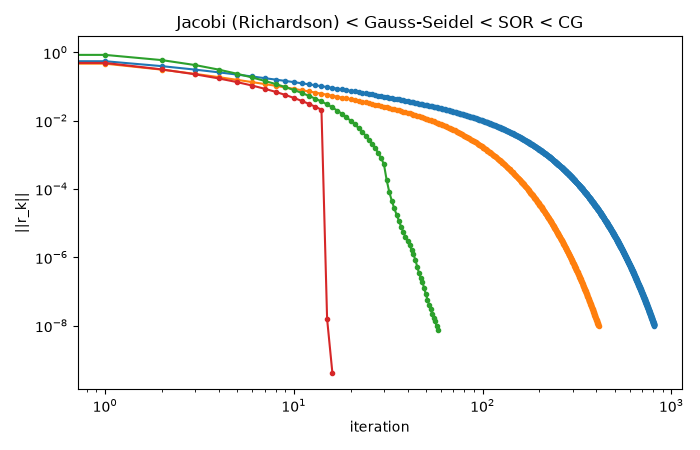
      jacobi:   812 iterations, max |u - direct| = 4.6e-08
gauss_seidel:   411 iterations, max |u - direct| = 4.4e-08
         sor:    58 iterations, max |u - direct| = 8.7e-09
          cg:    16 iterations, max |u - direct| = 2.9e-11
Total running time of the script: (0 minutes 0.762 seconds)
