
Note
Go to the end to download the full example code or to run this example in your browser via JupyterLite.
Multigrid: a solver whose cost does not grow with the grid#
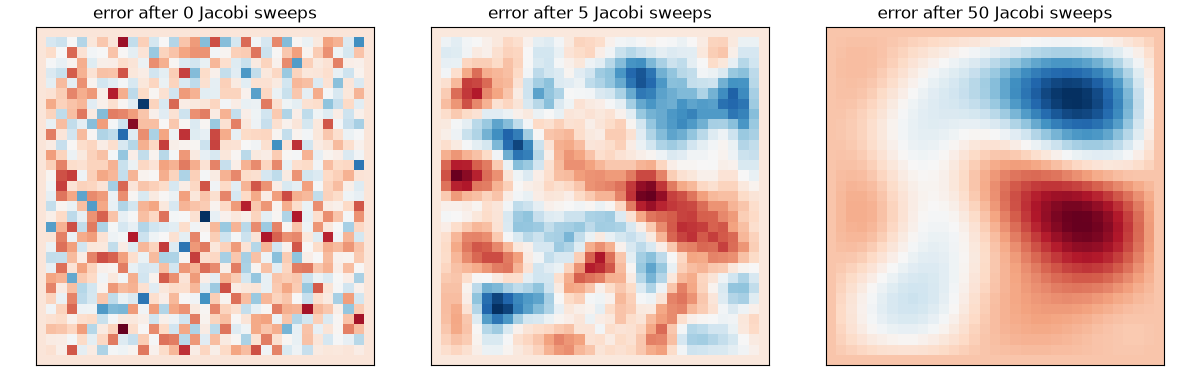
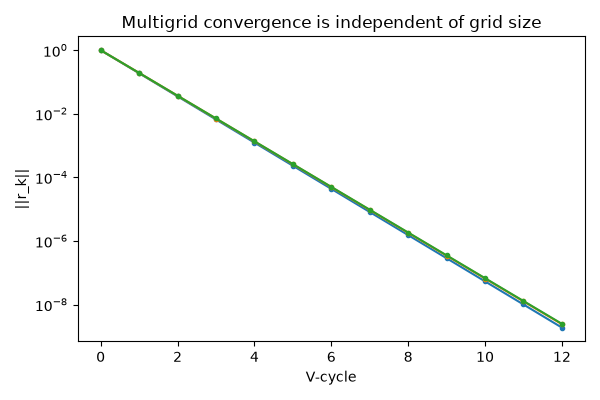
Relaxation kills wiggly error fast but smooth error slowly, so Jacobi’s iteration count grows like the number of grid points per side squared. Fedorenko (1964) and Brandt (1977) noticed that smooth error on a fine grid looks wiggly on a coarser one, where it is cheap to remove. A multigrid V-cycle smooths, corrects on successively coarser grids, and smooths again. The number of cycles needed stays flat as the grid is refined. This script shows Jacobi smoothing a random error, then compares cycle counts across grid sizes.
import matplotlib.pyplot as plt
import numpy as np

from mathematicskit.linalg.visualizers import plot_residual_history
from mathematicskit.pde import multigrid_poisson_2d, solve_poisson_2d
Relaxation smooths the error#
Solving Laplace’s equation (exact solution zero) from a random start, a few damped-Jacobi sweeps leave a smooth, slowly decaying error.
rng = np.random.default_rng(0)
n = 33
e = np.zeros((n, n))
e[1:-1, 1:-1] = rng.standard_normal((n - 2, n - 2))
fig1, axes = plt.subplots(1, 3, figsize=(12, 3.8))
for ax, sweeps in zip(axes, (0, 5, 50), strict=False):
    err = e.copy()
    for _ in range(sweeps):
        err[1:-1, 1:-1] = 0.2 * err[1:-1, 1:-1] + 0.8 * 0.25 * (err[:-2, 1:-1] + err[2:, 1:-1] + err[1:-1, :-2] + err[1:-1, 2:])
    ax.imshow(err.T, origin="lower", cmap="RdBu_r")
    ax.set_title(f"error after {sweeps} Jacobi sweeps")
    ax.set_xticks([])
    ax.set_yticks([])
fig1.tight_layout()
Cycle counts stay flat; Jacobi’s explode#
def source(X, Y):
    return -2 * np.pi**2 * np.sin(np.pi * X) * np.sin(np.pi * Y)


for m in (9, 17, 33, 65, 129, 257):
    mg = multigrid_poisson_2d(source, n=m)
    line = f"n = {m:3d} ({(m - 2) ** 2:6d} unknowns): multigrid {mg.solver_result.iterations:2d} V-cycles"
    if m <= 17:
        jac = solve_poisson_2d(source, n=(m, m), method="jacobi", tol=1e-8)
        line += f", Jacobi {jac.solver_result.iterations:4d} sweeps"
    print(line)

fig2, ax2 = plt.subplots(figsize=(6, 4))
for m in (17, 65, 257):
    plot_residual_history(multigrid_poisson_2d(source, n=m).solver_result, ax=ax2, label=f"n = {m}")
ax2.set_xlabel("V-cycle")
ax2.set_title("Multigrid convergence is independent of grid size")
fig2.tight_layout()

plt.show()
n =   9 (    49 unknowns): multigrid 11 V-cycles, Jacobi  233 sweeps
n =  17 (   225 unknowns): multigrid 12 V-cycles, Jacobi  950 sweeps
n =  33 (   961 unknowns): multigrid 12 V-cycles
n =  65 (  3969 unknowns): multigrid 12 V-cycles
n = 129 ( 16129 unknowns): multigrid 12 V-cycles
n = 257 ( 65025 unknowns): multigrid 12 V-cycles
Total running time of the script: (0 minutes 0.397 seconds)
