
Note
Go to the end to download the full example code or to run this example in your browser via JupyterLite.
Von Neumann stability analysis: one Fourier mode at a time#
John von Neumann’s method substitutes a single Fourier mode \(u_j^n = G^n e^{ij\xi}\) into a linear scheme. Each step multiplies the mode by the amplification factor \(G(\xi)\), so the scheme is stable exactly when \(|G(\xi)| \le 1\) for every wavenumber. This script plots \(|G|\) for heat and advection schemes, recovers the FTCS limit \(r \le 1/2\) numerically, and shows why FTCS advection is unstable for every time step.
import matplotlib.pyplot as plt
import numpy as np

from mathematicskit.pde import max_amplification
from mathematicskit.pde.visualizers import plot_amplification_factors
Heat-equation schemes#
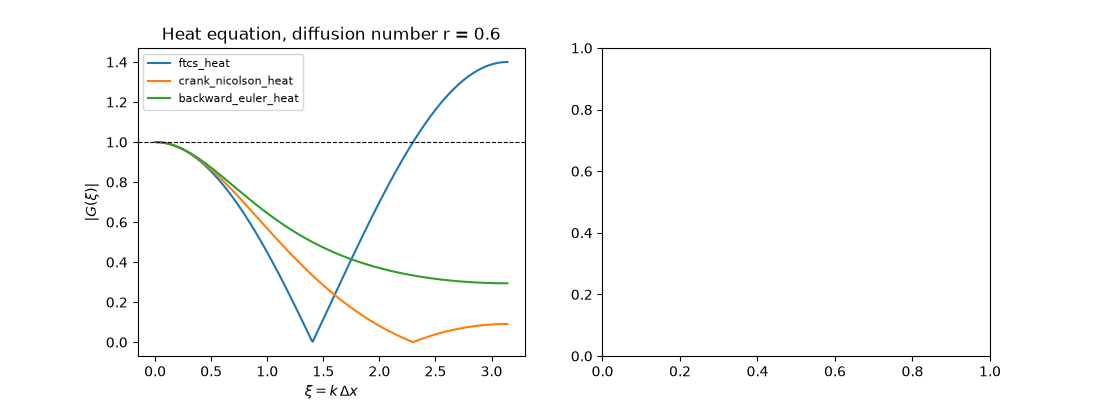
Text(0.5, 1.0, 'Heat equation, diffusion number r = 0.6')
Advection schemes#
Finding the stability limits numerically#
rs = np.linspace(0.3, 0.7, 401)
limit = rs[np.argmax([max_amplification("ftcs_heat", r) > 1 + 1e-12 for r in rs]) - 1]
print(f"FTCS heat is stable up to r = {limit:.3f} (theory: 1/2)")
for nu in (0.01, 0.5, 1.0):
    print(f"FTCS advection, nu = {nu}: max |G| = {max_amplification('ftcs_advection', nu):.6f}  (> 1 for every nu > 0)")
for r in (1.0, 100.0):
    print(f"Crank-Nicolson, r = {r}: max |G| = {max_amplification('crank_nicolson_heat', r):.3f}")

plt.show()
FTCS heat is stable up to r = 0.500 (theory: 1/2)
FTCS advection, nu = 0.01: max |G| = 1.000050  (> 1 for every nu > 0)
FTCS advection, nu = 0.5: max |G| = 1.118034  (> 1 for every nu > 0)
FTCS advection, nu = 1.0: max |G| = 1.414214  (> 1 for every nu > 0)
Crank-Nicolson, r = 1.0: max |G| = 1.000
Crank-Nicolson, r = 100.0: max |G| = 1.000
Total running time of the script: (0 minutes 0.191 seconds)
