
Note
Go to the end to download the full example code or to run this example in your browser via JupyterLite.
The Lax equivalence theorem: consistency + stability = convergence#
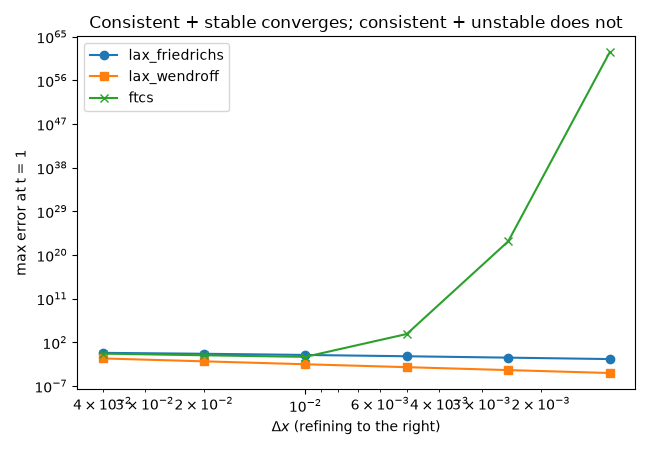
Peter Lax and Robert Richtmyer (1956) proved that a consistent linear difference scheme for a well-posed linear problem converges as the grid is refined if and only if it is stable. Consistency alone is not enough. This script refines the grid, at a fixed Courant number, for three schemes for \(u_t + u_x = 0\) that are all consistent. Stable Lax-Friedrichs converges at first order, and Lax-Wendroff at second. Unstable FTCS looks convergent on coarse grids, then explodes: finer grids take more steps, and its growing modes, seeded by round-off, eventually swamp the solution even though each step approximates the PDE more accurately.
import matplotlib.pyplot as plt
import numpy as np

from mathematicskit.pde import AdvectionEquation1D


def profile(x):
    return np.sin(2 * np.pi * x)


ns = np.array([25, 50, 100, 200, 400, 800])
results = {}
for scheme in ("lax_friedrichs", "lax_wendroff", "ftcs"):
    errors = []
    for n in ns:
        adv = AdvectionEquation1D(profile, n=n)
        sol = adv.solve(1.0, dt=0.5 * adv.dx, scheme=scheme)
        errors.append(np.max(np.abs(sol.final - adv.exact(1.0))))
    results[scheme] = np.array(errors)
    stable = AdvectionEquation1D(profile, n=50).solve(0.01, dt=0.01, scheme=scheme).extra["stability"].stable
    print(f"{scheme:>15}  stable at nu = 0.5: {stable!s:5}  errors: " + "  ".join(f"{e:.1e}" for e in errors))
lax_friedrichs  stable at nu = 0.5: True   errors: 7.0e-01  4.5e-01  2.6e-01  1.4e-01  7.1e-02  3.6e-02
  lax_wendroff  stable at nu = 0.5: True   errors: 4.9e-02  1.2e-02  3.1e-03  7.8e-04  1.9e-04  4.8e-05
          ftcs  stable at nu = 0.5: False  errors: 4.8e-01  2.2e-01  1.0e-01  5.3e+03  6.6e+22  5.8e+61
Stable schemes converge, the unstable one diverges#
fig, ax = plt.subplots(figsize=(6.5, 4.5))
dx = 1.0 / ns
for scheme, marker in (("lax_friedrichs", "o"), ("lax_wendroff", "s"), ("ftcs", "x")):
    ax.loglog(dx, results[scheme], marker + "-", label=scheme)
ax.invert_xaxis()
ax.set_xlabel(r"$\Delta x$ (refining to the right)")
ax.set_ylabel("max error at t = 1")
ax.set_title("Consistent + stable converges; consistent + unstable does not")
ax.legend()
fig.tight_layout()

plt.show()
Total running time of the script: (0 minutes 0.451 seconds)
