
Note
Go to the end to download the full example code or to run this example in your browser via JupyterLite.
Galton-Watson: the probability a family name dies out#
Each man has 0, 1, or 2 sons with probabilities 0.2, 0.3, 0.5. The extinction probability is the smallest fixed point of the generating function \(G(s) = 0.2 + 0.3s + 0.5s^2\), namely \(q = 0.4\), even though the population grows by 30% per generation on average.
import matplotlib.pyplot as plt
import numpy as np

from mathematicskit.probability import galton_watson_extinction_probability, galton_watson_simulate

pmf = [0.2, 0.3, 0.5]
The fixed point of the generating function#
q = galton_watson_extinction_probability(pmf)
s = np.linspace(0.0, 1.0, 200)
fig, ax = plt.subplots()
ax.plot(s, np.polynomial.polynomial.polyval(s, pmf), label="G(s)")
ax.plot(s, s, "k--", label="s")
ax.plot(q, q, "o", color="tab:red", label=f"q = {q:.4f}")
ax.set_xlabel("s")
ax.legend()
ax.set_title("Extinction probability = smallest root of G(s) = s")
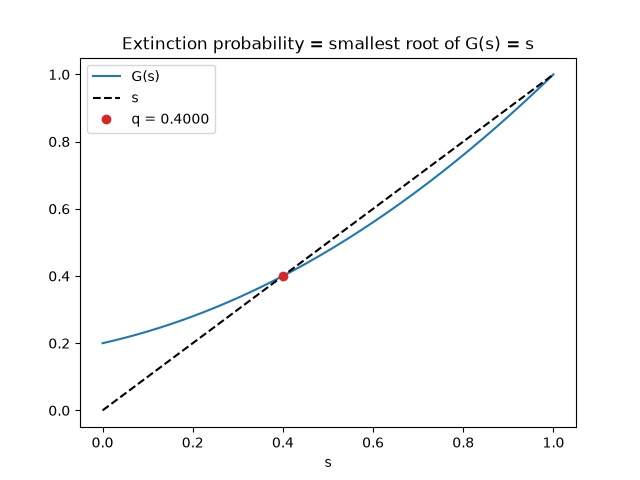
Text(0.5, 1.0, 'Extinction probability = smallest root of G(s) = s')
Simulated families#
result = galton_watson_simulate(pmf, n_generations=25, n_runs=10000, seed=0)
print(f"simulated extinction fraction: {result.extinct_fraction:.4f} (theory {q:.4f})")

fig, ax = plt.subplots()
for sizes in result.generation_sizes[:40]:
    ax.semilogy(np.where(sizes > 0, sizes, np.nan), color="tab:blue", alpha=0.4)
ax.set_xlabel("generation")
ax.set_ylabel("population")
ax.set_title("40 simulated families (dying lines stop)")
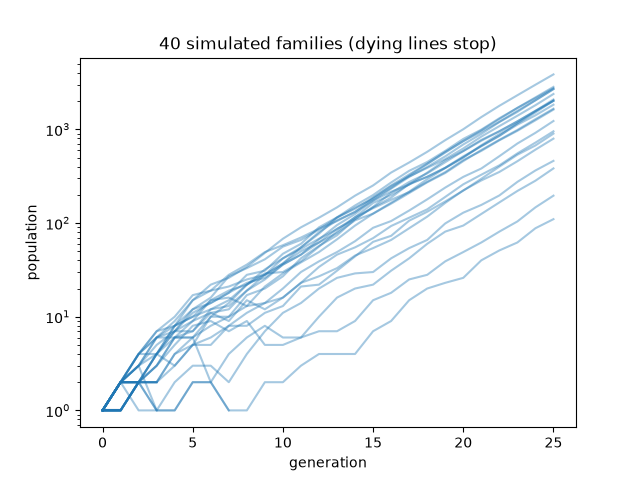
simulated extinction fraction: 0.3951 (theory 0.4000)

Text(0.5, 1.0, '40 simulated families (dying lines stop)')
Total running time of the script: (0 minutes 0.086 seconds)
