
Note
Go to the end to download the full example code or to run this example in your browser via JupyterLite.
The Airy functions Ai and Bi#
Plots Ai and Bi across the turning point x = 0 where y’’ = xy switches from oscillation to exponential behaviour, and checks the Wronskian Ai Bi’ - Ai’ Bi = 1/pi.
import matplotlib.pyplot as plt
import numpy as np

from mathematicskit.special_functions import airy_functions
Oscillation on the left, growth or decay on the right#
x = np.linspace(-15, 3, 18001)
r = airy_functions(x)
fig, ax = plt.subplots()
ax.plot(x, r.ai, label="Ai(x)")
ax.plot(x, r.bi, label="Bi(x)")
ax.axvline(0, color="gray", ls=":")
ax.set_ylim(-0.6, 1.2)
ax.set_xlabel("x")
ax.set_title(r"Solutions of $y'' = xy$")
ax.legend()
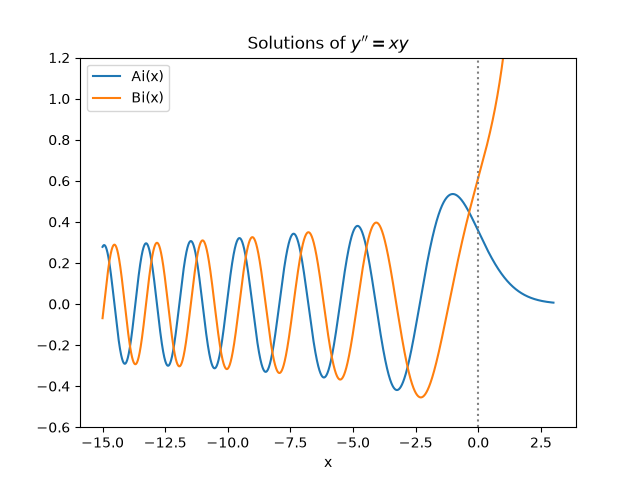
<matplotlib.legend.Legend object at 0x121893380>
Wronskian and the first zeros of Ai#
Wronskian range: [0.318309886184, 0.318309886184], 1/pi = 0.318309886184
first zeros of Ai near [-2.339 -4.088 -5.521] (known: -2.338, -4.088, -5.521)
Total running time of the script: (0 minutes 0.049 seconds)
