
Note
Go to the end to download the full example code or to run this example in your browser via JupyterLite.
Mathieu functions and their characteristic values#
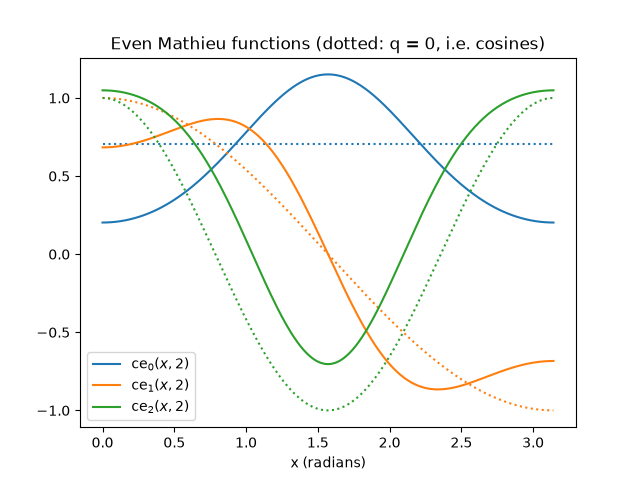
Plots the first even Mathieu functions ce_m(x, q) and how the characteristic values a_m(q), b_m(q) split away from m^2 as q grows – the band structure behind the Mathieu stability chart.
import matplotlib.pyplot as plt
import numpy as np

from mathematicskit.special_functions import mathieu_characteristic_a, mathieu_characteristic_b, mathieu_even
Even Mathieu functions at q = 2#
x = np.linspace(0, np.pi, 300)
q = 2.0
fig, ax = plt.subplots()
for m in range(3):
    ax.plot(x, mathieu_even(m, q, x), label=rf"$\mathrm{{ce}}_{m}(x, {q:g})$")
    ax.plot(x, mathieu_even(m, 0.0, x), ":", color=f"C{m}")
ax.set_xlabel("x (radians)")
ax.set_title("Even Mathieu functions (dotted: q = 0, i.e. cosines)")
ax.legend()
<matplotlib.legend.Legend object at 0x121891a90>
Characteristic values versus q#
qs = np.linspace(0, 10, 200)
fig, ax = plt.subplots()
for m in range(4):
    ax.plot(qs, [mathieu_characteristic_a(m, qq) for qq in qs], f"C{m}", label=f"$a_{m}$")
    if m >= 1:
        ax.plot(qs, [mathieu_characteristic_b(m, qq) for qq in qs], f"C{m}--", label=f"$b_{m}$")
ax.set_xlabel("q")
ax.set_ylabel("characteristic value")
ax.legend(ncol=2)
for m in range(4):
    print(f"a_{m}(0) = {mathieu_characteristic_a(m, 0.0) + 0.0:.1f}, a_{m}(10) = {mathieu_characteristic_a(m, 10.0):.4f}")
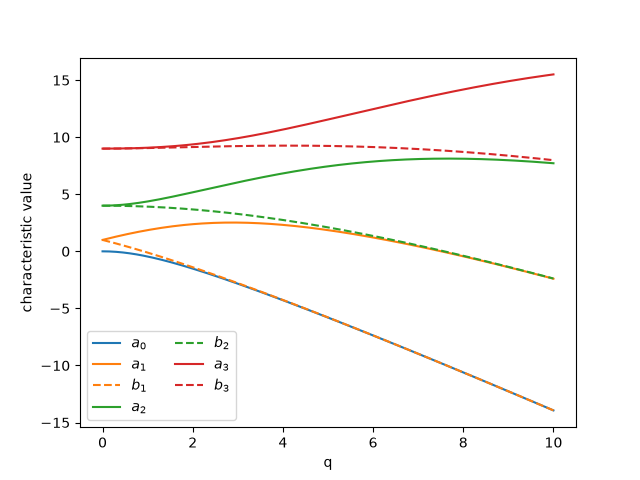
a_0(0) = 0.0, a_0(10) = -13.9370
a_1(0) = 1.0, a_1(10) = -2.3991
a_2(0) = 4.0, a_2(10) = 7.7174
a_3(0) = 9.0, a_3(10) = 15.5028
Total running time of the script: (0 minutes 0.059 seconds)
