
Note
Go to the end to download the full example code or to run this example in your browser via JupyterLite.
The jackknife#
Leaves out one observation at a time and recomputes the statistic. For the plug-in variance, the jackknife’s bias correction recovers the unbiased n - 1 variance exactly, and for the mean its standard error is exactly the classical s / sqrt(n). For a non-smooth statistic such as the midrange, the jackknife standard error is unreliable and disagrees with the bootstrap’s – one of the shortcomings Efron’s bootstrap was designed to overcome.
import matplotlib.pyplot as plt
import numpy as np

from mathematicskit.statistics import bootstrap_confidence_interval, jackknife
Bias correction of the plug-in variance#
rng = np.random.default_rng(0)
data = rng.normal(loc=10.0, scale=3.0, size=20)
var_result = jackknife(data, np.var)
print(f"plug-in variance    {var_result.estimate:.4f}")
print(f"jackknife-corrected {var_result.bias_corrected:.4f}")
print(f"unbiased (ddof=1)   {np.var(data, ddof=1):.4f}")
plug-in variance    6.5159
jackknife-corrected 6.8588
unbiased (ddof=1)   6.8588
Standard error of the mean and of a non-smooth statistic#
def midrange(x):
    return 0.5 * (np.min(x) + np.max(x))


mean_result = jackknife(data, np.mean)
print(f"\nmean: jackknife SE {mean_result.std_error:.4f}, s/sqrt(n) {np.std(data, ddof=1) / np.sqrt(data.size):.4f}")
mid_result = jackknife(data, midrange)
mid_boot = bootstrap_confidence_interval(data, statistic=midrange, n_resamples=4000, method="percentile", seed=0)
print(f"midrange: jackknife SE {mid_result.std_error:.4f}, bootstrap SE {mid_boot.std_error:.4f}")

fig, ax = plt.subplots()
ax.plot(mean_result.replicates, "o", label="leave-one-out means")
ax.axhline(mean_result.estimate, color="k", lw=1, label="full-sample mean")
ax.set_xlabel("observation left out")
ax.legend()
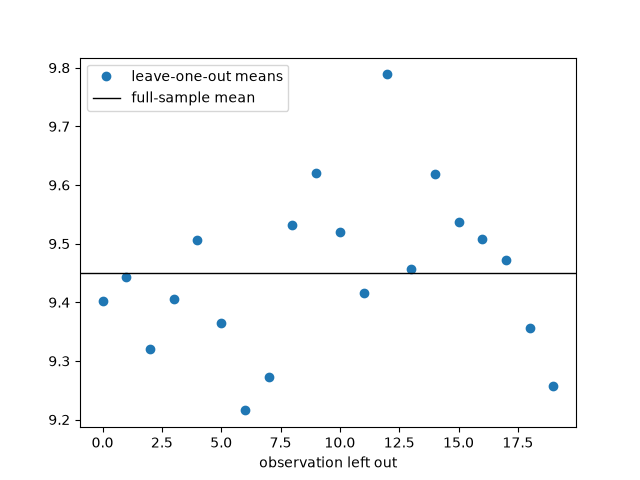
mean: jackknife SE 0.5856, s/sqrt(n) 0.5856
midrange: jackknife SE 1.5742, bootstrap SE 0.8834

<matplotlib.legend.Legend object at 0x1219c92b0>
Total running time of the script: (0 minutes 0.037 seconds)
