
Note
Go to the end to download the full example code or to run this example in your browser via JupyterLite.
Confirming a 95% confidence interval’s coverage by simulation#
Builds many 95% confidence intervals from repeated samples of a known population, and checks that close to 95% of them actually contain the true parameter – the frequentist interpretation of “95% confidence.”
import matplotlib.pyplot as plt
import numpy as np

from mathematicskit.statistics import mean_confidence_interval, proportion_confidence_interval
Mean confidence interval coverage#
rng = np.random.default_rng(0)
true_mean = 50.0
n_trials = 2000
intervals = []
for _ in range(n_trials):
    sample = rng.normal(loc=true_mean, scale=10.0, size=40)
    result = mean_confidence_interval(sample, sigma=10.0)
    intervals.append((result.lower, result.upper))
intervals = np.array(intervals)
hits = (intervals[:, 0] < true_mean) & (true_mean < intervals[:, 1])

print(f"mean CI empirical coverage: {hits.mean():.4f} (target 0.95)")
mean CI empirical coverage: 0.9445 (target 0.95)
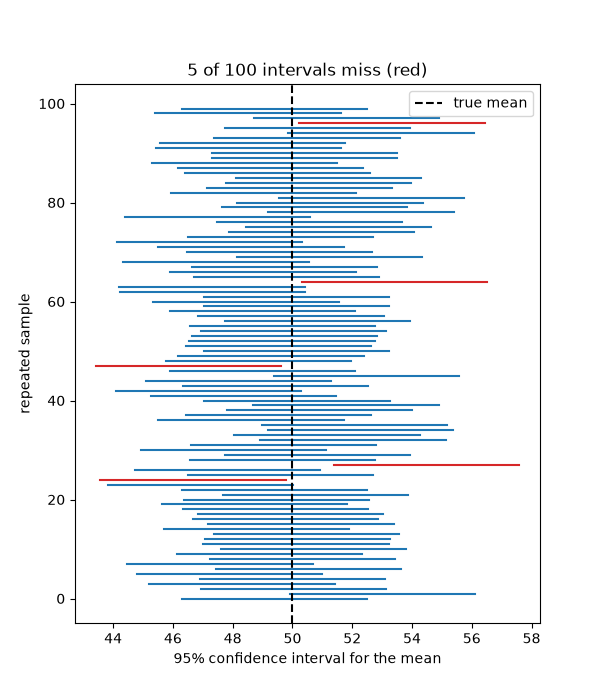
The first 100 intervals#
Each interval either contains the true mean or it does not; “95%” is the long-run hit rate of the procedure, visible as the few misses.
fig, ax = plt.subplots(figsize=(6, 7))
for i, ((lo, hi), hit) in enumerate(zip(intervals[:100], hits[:100], strict=False)):
    ax.plot([lo, hi], [i, i], color="C0" if hit else "C3", lw=1.5)
ax.axvline(true_mean, color="k", ls="--", label="true mean")
ax.set_xlabel("95% confidence interval for the mean")
ax.set_ylabel("repeated sample")
ax.set_title(f"{np.sum(~hits[:100])} of 100 intervals miss (red)")
ax.legend()
<matplotlib.legend.Legend object at 0x1219caa50>
Proportion confidence interval#
result = proportion_confidence_interval(successes=42, n=100)
print(f"proportion estimate: {result.estimate:.3f}, 95% CI: ({result.lower:.3f}, {result.upper:.3f})")
proportion estimate: 0.420, 95% CI: (0.323, 0.517)
Total running time of the script: (0 minutes 0.083 seconds)
