
Note
Go to the end to download the full example code or to run this example in your browser via JupyterLite.
Fisher’s one-way analysis of variance#
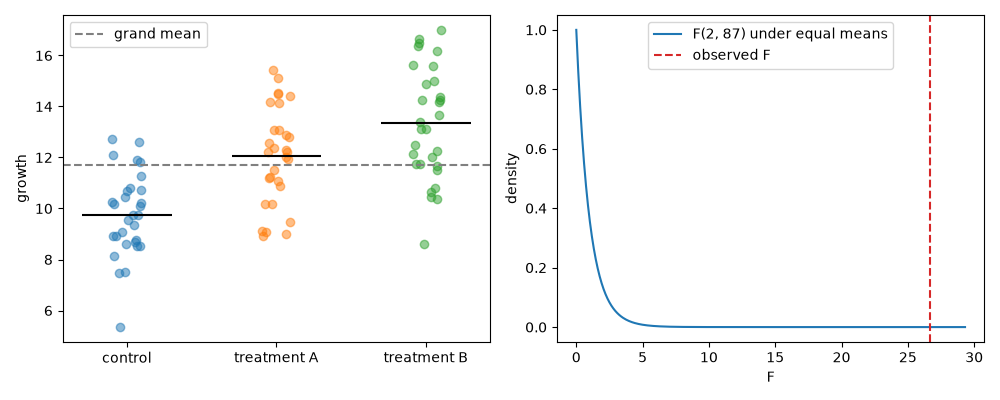
Compares three fertilizer treatments’ effect on plant growth, as in Fisher’s Rothamsted field trials. ANOVA splits the total variability into a between-groups and a within-groups sum of squares; their ratio, the F-statistic, tests all group means for equality in one test.
import matplotlib.pyplot as plt
import numpy as np
from scipy import stats

from mathematicskit.statistics import one_way_anova
Simulated data: three treatment groups#
rng = np.random.default_rng(0)
groups = {
    "control": rng.normal(loc=10.0, scale=2.0, size=30),
    "treatment A": rng.normal(loc=11.5, scale=2.0, size=30),
    "treatment B": rng.normal(loc=13.0, scale=2.0, size=30),
}
Partitioning the sum of squares#
values = list(groups.values())
grand_mean = np.concatenate(values).mean()
ss_total = sum(np.sum((g - grand_mean) ** 2) for g in values)
ss_between = sum(g.size * (g.mean() - grand_mean) ** 2 for g in values)
ss_within = sum(np.sum((g - g.mean()) ** 2) for g in values)
print(f"SS_total = {ss_total:.2f} = SS_between {ss_between:.2f} + SS_within {ss_within:.2f}")

result = one_way_anova(*values)
df_between, df_within = result.df, result.extra["df_within"]
f_manual = (ss_between / df_between) / (ss_within / df_within)
print(f"F = {result.statistic:.3f} (by hand {f_manual:.3f}) on ({df_between:.0f}, {df_within:.0f}) df, p = {result.p_value:.2e}")
print("group means:", np.round(result.extra["group_means"], 3))
SS_total = 522.68 = SS_between 198.54 + SS_within 324.14
F = 26.645 (by hand 26.645) on (2, 87) df, p = 9.41e-10
group means: [ 9.757 12.052 13.349]
Groups around the grand mean, and the F reference distribution#
fig, (ax1, ax2) = plt.subplots(1, 2, figsize=(10, 4))
for i, g in enumerate(values):
    ax1.plot(np.full(g.size, i) + rng.uniform(-0.1, 0.1, g.size), g, "o", alpha=0.5)
    ax1.hlines(g.mean(), i - 0.3, i + 0.3, color="k")
ax1.axhline(grand_mean, color="gray", ls="--", label="grand mean")
ax1.set_xticks(range(len(groups)), list(groups))
ax1.set_ylabel("growth")
ax1.legend()

f_grid = np.linspace(0.0, max(12.0, result.statistic * 1.1), 400)
ax2.plot(f_grid, stats.f.pdf(f_grid, df_between, df_within), label=f"F({df_between:.0f}, {df_within:.0f}) under equal means")
ax2.axvline(result.statistic, color="C3", ls="--", label="observed F")
ax2.set_xlabel("F")
ax2.set_ylabel("density")
ax2.legend()
fig.tight_layout()
Total running time of the script: (0 minutes 0.051 seconds)
