
Note
Go to the end to download the full example code or to run this example in your browser via JupyterLite.
The Kolmogorov-Smirnov test#
Draws a sample from a Student t distribution with 3 degrees of freedom and compares its empirical CDF with the standard normal CDF. The KS statistic is the largest vertical gap between the two curves.
import matplotlib.pyplot as plt
import numpy as np
from scipy import stats

from mathematicskit.statistics import kolmogorov_smirnov_test
One sample against a model#
rng = np.random.default_rng(0)
data = np.sort(rng.standard_t(df=3, size=800))
result = kolmogorov_smirnov_test(data, "norm")
print(f"vs. N(0,1):  D = {result.statistic:.4f}, p = {result.p_value:.4f}")
print(f"vs. t(3):    p = {kolmogorov_smirnov_test(data, stats.t(df=3).cdf).p_value:.4f}")

ecdf = np.arange(1, data.size + 1) / data.size
fig, ax = plt.subplots()
ax.step(data, ecdf, where="post", label="empirical CDF")
ax.plot(data, stats.norm.cdf(data), label="normal CDF")
model = stats.norm.cdf(data)
above, below = ecdf - model, model - (ecdf - 1 / data.size)
k = int(np.argmax(np.maximum(above, below)))
top = ecdf[k] if above[k] >= below[k] else ecdf[k] - 1 / data.size
ax.vlines(data[k], model[k], top, color="C3", lw=3, label=f"D = {result.statistic:.3f}")
ax.legend()
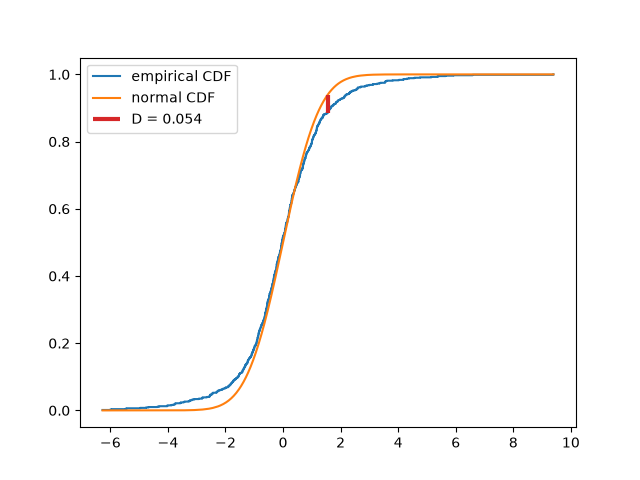
vs. N(0,1):  D = 0.0539, p = 0.0184
vs. t(3):    p = 0.6969

<matplotlib.legend.Legend object at 0x121893b60>
Two samples#
other = rng.normal(size=300)
two = kolmogorov_smirnov_test(data, other)
print(f"two-sample:  D = {two.statistic:.4f}, p = {two.p_value:.4f}")
two-sample: D = 0.0708, p = 0.2139
Total running time of the script: (0 minutes 0.025 seconds)
