
Note
Go to the end to download the full example code or to run this example in your browser via JupyterLite.
Stein’s paradox#
Estimates p unrelated normal means from one observation each. Shrinking all the observations toward zero by the James-Stein factor lowers the total squared error for every p >= 3, even though no single observation carries information about the others.
import matplotlib.pyplot as plt
import numpy as np

from mathematicskit.statistics import james_stein_estimator
Risk as a function of dimension#
rng = np.random.default_rng(0)
dims = np.arange(3, 31)
raw_risk, js_risk = [], []
for p in dims:
    theta = rng.normal(scale=1.5, size=p)
    x = theta + rng.normal(size=(2000, p))
    shrunk = np.array([james_stein_estimator(row) for row in x])
    raw_risk.append(np.mean(np.sum((x - theta) ** 2, axis=1)))
    js_risk.append(np.mean(np.sum((shrunk - theta) ** 2, axis=1)))
    if p in (3, 10, 30):
        print(f"p={p:2d}: raw risk {raw_risk[-1]:6.2f}, James-Stein risk {js_risk[-1]:6.2f}")

fig, ax = plt.subplots()
ax.plot(dims, raw_risk, "o-", label="x (risk = p)")
ax.plot(dims, js_risk, "s-", label="James-Stein")
ax.set_xlabel("dimension p")
ax.set_ylabel("mean total squared error")
ax.legend()
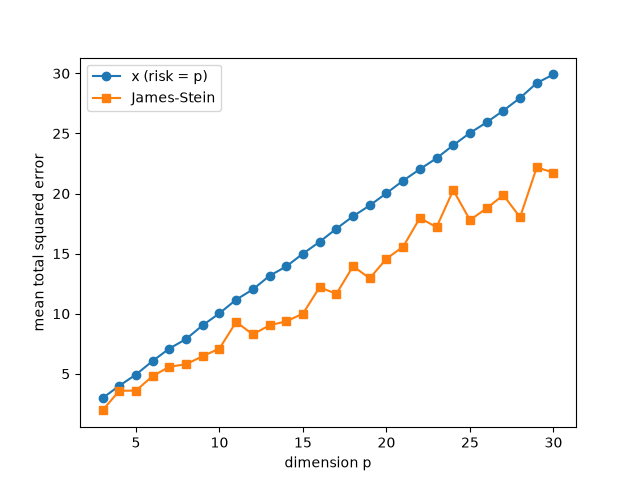
p= 3: raw risk   2.97, James-Stein risk   1.95
p=10: raw risk  10.03, James-Stein risk   7.10
p=30: raw risk  29.92, James-Stein risk  21.74

<matplotlib.legend.Legend object at 0x121892510>
Total running time of the script: (0 minutes 0.104 seconds)
