
Note
Go to the end to download the full example code or to run this example in your browser via JupyterLite.
The Mayer-Vietoris sequence (1929-1930)#
Walther Mayer and Leopold Vietoris computed the homology of a union from its pieces through the long exact sequence
\[\cdots \to H_k(A\cap B) \to H_k(A)\oplus H_k(B) \to H_k(A\cup B) \to H_{k-1}(A\cap B) \to \cdots\]
Cut a torus into two annuli \(A\) and \(B\). They meet in two circles. Exactness, plus the rank of the map induced by the inclusions, predicts \(\beta(T^2) = (1, 2, 1)\). The second loop of the torus comes from the connecting map \(\delta\).
import matplotlib.pyplot as plt

from mathematicskit.topology import circle, mayer_vietoris, sphere, torus
from mathematicskit.topology.visualizers import plot_complex

T = torus(16, 6)
A = T.induced_subcomplex([v for v in T.vertices if v // 6 in range(9)])
B = T.induced_subcomplex([v for v in T.vertices if v // 6 in (*range(8, 16), 0)])
cases = {"torus = annulus ∪ annulus": (A, B)}
C = circle(8)
cases["circle = arc ∪ arc"] = (C.induced_subcomplex(range(5)), C.induced_subcomplex([4, 5, 6, 7, 0]))
S = sphere(2, "cross_polytope")
cases["sphere = disc ∪ disc"] = (S.induced_subcomplex([0, 1, 2, 3, 4]), S.induced_subcomplex([0, 1, 2, 3, 5]))
for name, (X, Y) in cases.items():
    r = mayer_vietoris(X, Y)
    print(f"{name}: beta(A) = {r.betti_a}, beta(B) = {r.betti_b}, beta(A∩B) = {r.betti_intersection}, rank i_* = {r.rank_inclusion}")
    print(f"{'':>26} predicted beta(A∪B) = {r.predicted_union}, computed = {r.betti_union}")
torus = annulus ∪ annulus: beta(A) = (1, 1, 0), beta(B) = (1, 1, 0), beta(A∩B) = (2, 2), rank i_* = (1, 1, 0)
                           predicted beta(A∪B) = (1, 2, 1), computed = (1, 2, 1)
circle = arc ∪ arc: beta(A) = (1, 0), beta(B) = (1, 0), beta(A∩B) = (2,), rank i_* = (1, 0)
                           predicted beta(A∪B) = (1, 1), computed = (1, 1)
sphere = disc ∪ disc: beta(A) = (1, 0, 0), beta(B) = (1, 0, 0), beta(A∩B) = (1, 1), rank i_* = (1, 0, 0)
                           predicted beta(A∪B) = (1, 0, 1), computed = (1, 0, 1)
The two annuli and their intersection#
fig = plt.figure(figsize=(7, 6))
ax = fig.add_subplot(projection="3d", computed_zorder=False)
plot_complex(A, ax=ax, face_color="tab:blue", alpha=0.35, vertex_size=0)
plot_complex(B, ax=ax, face_color="tab:orange", alpha=0.35, vertex_size=0)
for edge in (A & B).simplices(1):
    ax.plot(*T.coordinates[list(edge)].T, color="k", lw=3)
ax.view_init(elev=50, azim=-60)
ax.set_axis_off()
ax.set_title("A (blue) ∪ B (orange) = torus; A ∩ B = two circles")
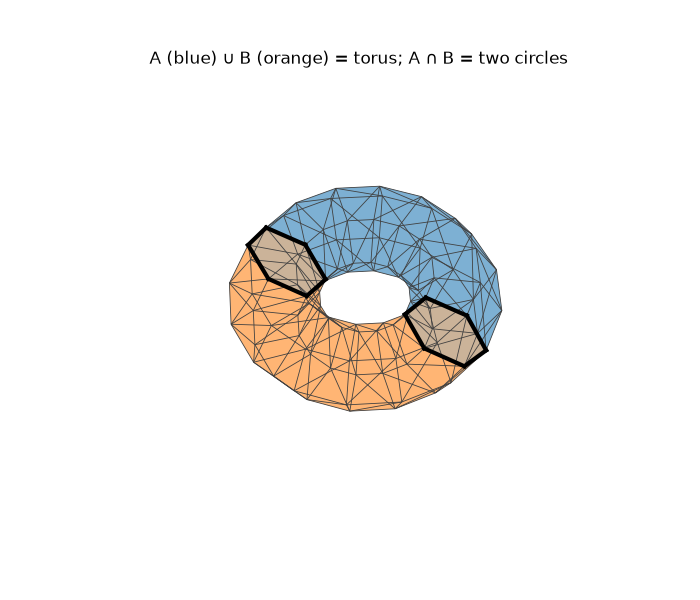
Text(0.5, 1.0, 'A (blue) ∪ B (orange) = torus; A ∩ B = two circles')
Total running time of the script: (0 minutes 0.032 seconds)
