
Note
Go to the end to download the full example code or to run this example in your browser via JupyterLite.
Lefschetz’s fixed-point theorem and Hopf’s trace formula (1926-1929)#
Solomon Lefschetz assigned to every self-map \(f\) of a complex the number \(L(f) = \sum_k (-1)^k \operatorname{tr}(f_*: H_k \to H_k)\), and proved that \(L(f) \ne 0\) forces a fixed point. Hopf showed the same alternating trace can be computed on chains, where it counts the simplices \(f\) maps to themselves. The identity has \(L = \chi\). A rotation of the circle has \(L = 0\) and indeed moves every point. A reflection has \(L = 2\): its two fixed points. The antipodal map of the sphere has \(L = 1 + (-1)^3 = 0\). The converse fails: \(L = 0\) does not rule fixed points out, as the identity of the torus shows.
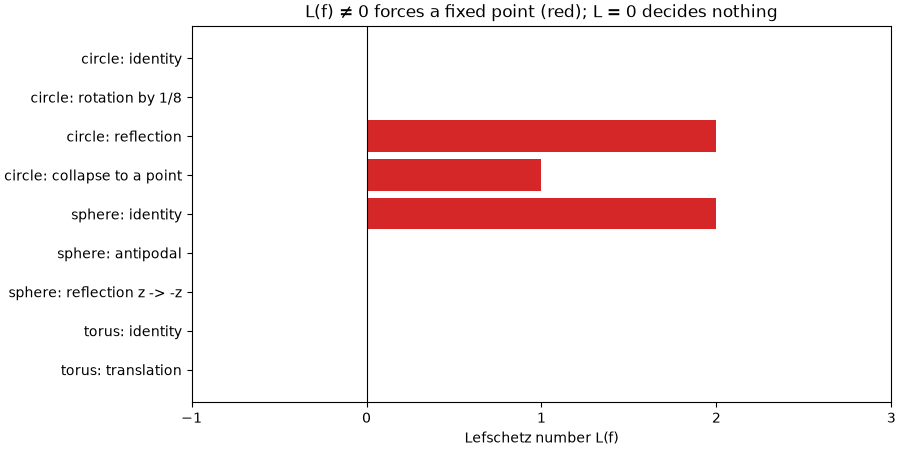
            circle: identity: L = +0   fixed vertices: [0, 1, 2, 3, 4, 5, 6, 7]
     circle: rotation by 1/8: L = +0   fixed vertices: []
          circle: reflection: L = +2   fixed vertices: [0, 4]
 circle: collapse to a point: L = +1   fixed vertices: [0]
            sphere: identity: L = +2   fixed vertices: [0, 1, 2, 3, 4, 5]
           sphere: antipodal: L = +0   fixed vertices: []
  sphere: reflection z -> -z: L = +0   fixed vertices: [0, 1, 2, 3]
             torus: identity: L = +0   fixed vertices: [0, 1, 2, 3, 4, 5, 6, 7, 8, 9, 10, 11, 12, 13, 14, 15]
          torus: translation: L = +0   fixed vertices: []

[<matplotlib.axis.XTick object at 0x117049450>, <matplotlib.axis.XTick object at 0x11732b750>, <matplotlib.axis.XTick object at 0x117329810>, <matplotlib.axis.XTick object at 0x117329090>, <matplotlib.axis.XTick object at 0x1173287d0>]
import matplotlib.pyplot as plt
import numpy as np

from mathematicskit.topology import circle, lefschetz_number, sphere, torus

C = circle(8)
octahedron = sphere(2, "cross_polytope")
T = torus(4, 4)
maps = {
    "circle: identity": (C, list(range(8))),
    "circle: rotation by 1/8": (C, [(v + 1) % 8 for v in range(8)]),
    "circle: reflection": (C, [(-v) % 8 for v in range(8)]),
    "circle: collapse to a point": (C, [0] * 8),
    "sphere: identity": (octahedron, list(range(6))),
    "sphere: antipodal": (octahedron, [v ^ 1 for v in range(6)]),
    "sphere: reflection z -> -z": (octahedron, [v ^ 1 if v >= 4 else v for v in range(6)]),
    "torus: identity": (T, list(range(16))),
    "torus: translation": (T, [((v // 4 + 1) % 4) * 4 + v % 4 for v in range(16)]),
}
names, values = [], []
for name, (K, f) in maps.items():
    L = lefschetz_number(K, f)
    fixed = [v for v in range(len(f)) if f[v] == v]
    print(f"{name:>28}: L = {L:+d}   fixed vertices: {fixed}")
    names.append(name)
    values.append(L)

fig, ax = plt.subplots(figsize=(9, 4.5), layout="constrained")
ax.barh(names, values, color=["tab:red" if v else "0.6" for v in values])
ax.axvline(0, color="k", lw=0.8)
ax.invert_yaxis()
ax.set_xlabel("Lefschetz number L(f)")
ax.set_title("L(f) ≠ 0 forces a fixed point (red); L = 0 decides nothing")
ax.set_xticks(np.arange(-1, 4))
Total running time of the script: (0 minutes 0.051 seconds)
