
Note
Go to the end to download the full example code or to run this example in your browser via JupyterLite.
Betti’s connectivity numbers (1871)#
Enrico Betti counted the independent closed curves, surfaces, and so on, that do not bound in a space. In Poincaré’s later algebra these are the ranks \(\beta_k = \dim\ker\partial_k - \operatorname{rk}\partial_{k+1}\): cycles minus boundaries. \(\beta_0\) counts pieces, \(\beta_1\) independent loops, and \(\beta_2\) enclosed cavities. The bars show the bookkeeping for each space: chains \(f_k\), cycles, and boundaries.
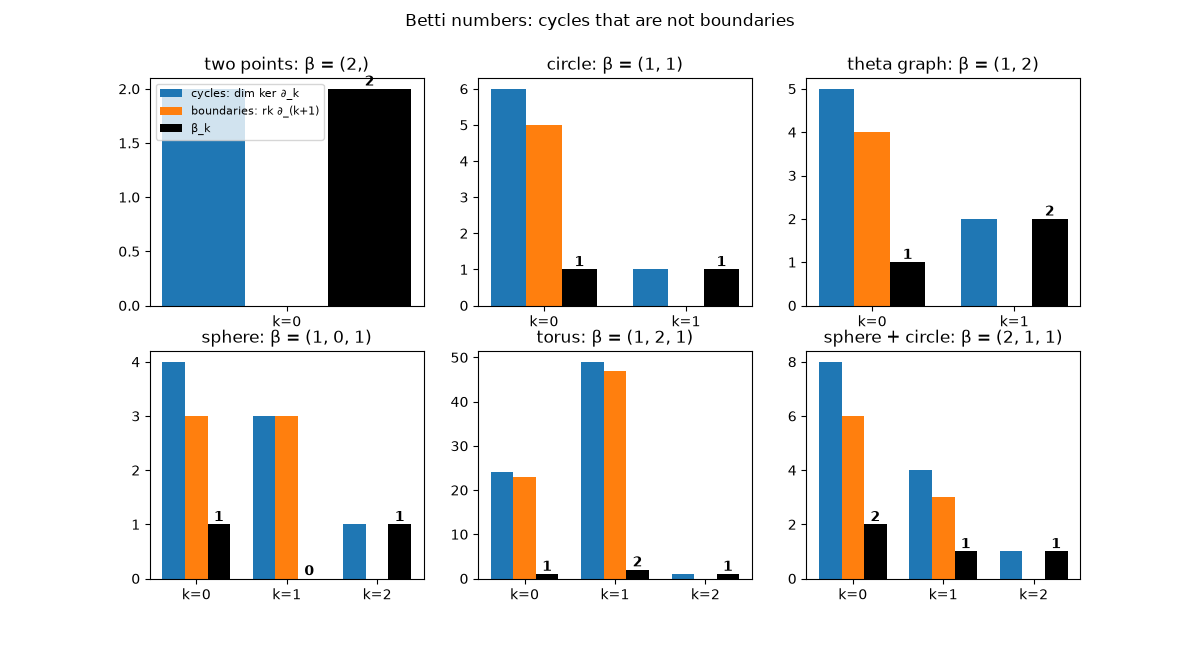
      two points: f = (2,), Betti numbers = (2,)
          circle: f = (6, 6), Betti numbers = (1, 1)
     theta graph: f = (5, 6), Betti numbers = (1, 2)
          sphere: f = (4, 6, 4), Betti numbers = (1, 0, 1)
           torus: f = (24, 72, 48), Betti numbers = (1, 2, 1)
 sphere + circle: f = (8, 10, 4), Betti numbers = (2, 1, 1)

Text(0.5, 0.98, 'Betti numbers: cycles that are not boundaries')
import matplotlib.pyplot as plt
import numpy as np

from mathematicskit.topology import SimplicialComplex, betti_numbers, circle, sphere, torus

theta = SimplicialComplex([[0, 1], [1, 2], [2, 3], [3, 0], [0, 4], [4, 2]])
spaces = {
    "two points": SimplicialComplex([[0], [1]]),
    "circle": circle(6),
    "theta graph": theta,
    "sphere": sphere(2),
    "torus": torus(6, 4),
    "sphere + circle": sphere(2) | SimplicialComplex([[i + 10, (i + 1) % 4 + 10] for i in range(4)]),
}

fig, axes = plt.subplots(2, 3, figsize=(12, 6.5))
for ax, (name, K) in zip(axes.ravel(), spaces.items(), strict=True):
    ranks = [np.linalg.matrix_rank(K.boundary_matrix(k)) if K.boundary_matrix(k).size else 0 for k in range(K.dimension + 2)]
    f = np.array(K.f_vector)
    cycles = f - np.array(ranks[: len(f)])
    boundaries = np.array(ranks[1 : len(f) + 1])
    betti = betti_numbers(K)
    print(f"{name:>16}: f = {K.f_vector}, Betti numbers = {betti}")
    k = np.arange(len(f))
    ax.bar(k - 0.25, cycles, 0.25, label="cycles: dim ker ∂_k")
    ax.bar(k, boundaries, 0.25, label="boundaries: rk ∂_(k+1)")
    ax.bar(k + 0.25, betti, 0.25, label="β_k", color="k")
    for i, b in enumerate(betti):
        ax.annotate(str(b), (i + 0.25, b), ha="center", va="bottom", fontweight="bold")
    ax.set_xticks(k, [f"k={i}" for i in k])
    ax.set_title(f"{name}: β = {betti}")
axes[0, 0].legend(fontsize=8)
fig.suptitle("Betti numbers: cycles that are not boundaries")
Total running time of the script: (0 minutes 0.102 seconds)
