
Note
Go to the end to download the full example code or to run this example in your browser via JupyterLite.
Morse theory and Banchoff’s critical points (1925-1967)#
Morse related the critical points of a function on a manifold to its topology: the alternating count of minima, saddles and maxima is the Euler characteristic. Banchoff found the polyhedral version. Charge each simplex to its highest vertex, and a vertex’s index is the alternating count of what it receives. On an upright torus the height has one minimum, two saddles and one maximum (\(1 - 2 + 1 = 0\)). A wobblier height function has more critical points, but the alternating sum stays at 0.
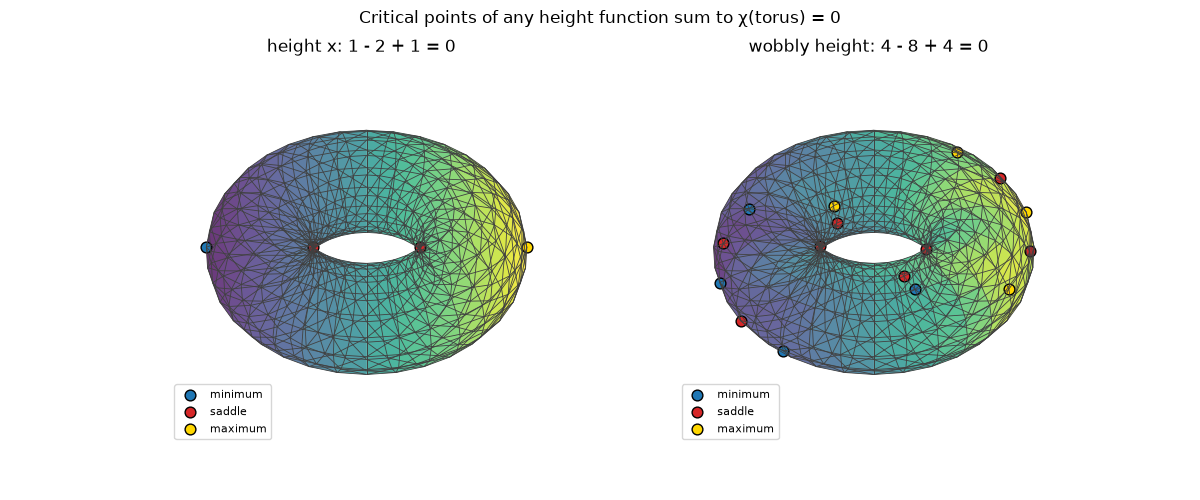
height x: 1 minima, 2 saddles, 1 maxima; total index 0
wobbly height: 4 minima, 8 saddles, 4 maxima; total index 0

Text(0.5, 0.98, 'Critical points of any height function sum to χ(torus) = 0')
import matplotlib.pyplot as plt
import numpy as np

from mathematicskit.topology import critical_points, torus
from mathematicskit.topology.visualizers import plot_complex

T = torus(32, 16)
x, y, z = T.coordinates.T
heights = {
    "height x": x + 1e-3 * z,
    "wobbly height": x + 0.6 * np.sin(3 * y) + 0.3 * z,
}

fig = plt.figure(figsize=(12, 5))
for i, (name, h) in enumerate(heights.items()):
    result = critical_points(T, h)
    print(f"{name}: {len(result.minima)} minima, {len(result.saddles)} saddles, {len(result.maxima)} maxima; total index {result.euler_characteristic}")
    ax = fig.add_subplot(1, 2, i + 1, projection="3d", computed_zorder=False)
    plot_complex(T, ax=ax, face_values=[h[list(t)].mean() for t in T.simplices(2)], alpha=0.55, vertex_size=0)
    for vertices, color, label in ((result.minima, "tab:blue", "minimum"), (result.saddles, "tab:red", "saddle"), (result.maxima, "gold", "maximum")):
        ax.scatter(*T.coordinates[vertices].T, s=60, color=color, edgecolors="k", depthshade=False, label=label)
    ax.view_init(elev=40, azim=-90)
    ax.set_box_aspect((1, 1, 1), zoom=1.4)
    ax.set_axis_off()
    ax.set_title(f"{name}: {len(result.minima)} - {len(result.saddles)} + {len(result.maxima)} = {result.euler_characteristic}")
    ax.legend(loc="lower left", fontsize=8)
fig.suptitle("Critical points of any height function sum to χ(torus) = 0")
Total running time of the script: (0 minutes 0.080 seconds)
