
Note
Go to the end to download the full example code or to run this example in your browser via JupyterLite.
Lutz: forward rates#
Friedrich Lutz (1940) read the term structure as a sequence of expected future short rates. The forward rate for the period from \(t_1\) to \(t_2\) is what the zero curve locks in today,
\[f(t_1, t_2) = \frac{r_2 t_2 - r_1 t_1}{t_2 - t_1},\]
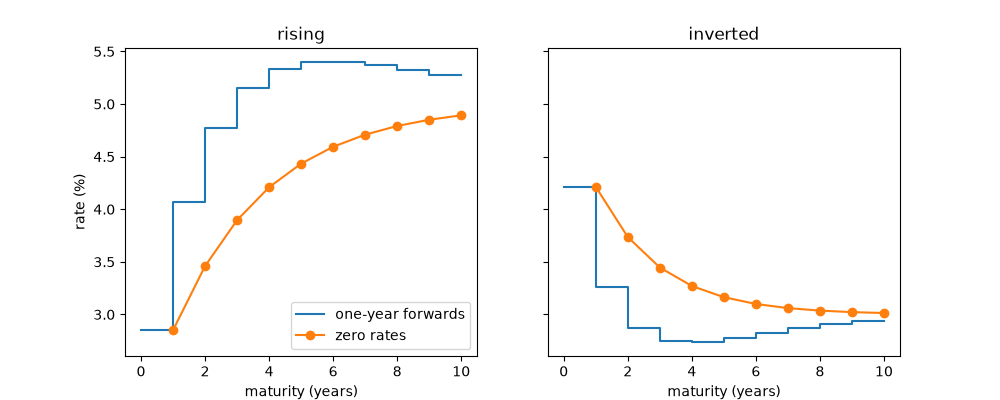
and each zero rate is the time average of the forwards before it. A rising zero curve therefore has forwards above it, and a falling one has forwards below it.
import matplotlib.pyplot as plt
import numpy as np

from financialkit.fixed_income import ZeroCurve, forward_rates
Hull’s Table 4.5#
year 1: zero 3.00%  forward for year 1 3.00%
year 2: zero 4.00%  forward for year 2 5.00%
year 3: zero 4.60%  forward for year 3 5.80%
year 4: zero 5.00%  forward for year 4 6.20%
year 5: zero 5.30%  forward for year 5 6.50%
Forwards above a rising curve, below a falling one#
fig, axes = plt.subplots(1, 2, figsize=(10, 4), sharey=True)
t = np.arange(1, 11, dtype=float)
shapes = {"rising": 0.02 + 0.03 * (1 - np.exp(-t / 3)), "inverted": 0.05 - 0.02 * (1 - np.exp(-t / 2))}
for ax, (name, r) in zip(axes, shapes.items(), strict=True):
    f = forward_rates(t, r)
    ax.step(np.r_[0, t], 100 * np.r_[f, f[-1]], where="post", label="one-year forwards")
    ax.plot(t, 100 * r, "o-", label="zero rates")
    ax.set_title(name)
    ax.set_xlabel("maturity (years)")
axes[0].set_ylabel("rate (%)")
axes[0].legend()
<matplotlib.legend.Legend object at 0x116d9cc20>
Zero rates are time averages of forwards#
max |average of forwards - zero rate| = 0.0
Total running time of the script: (0 minutes 0.034 seconds)
