
Note
Go to the end to download the full example code or to run this example in your browser via JupyterLite.
Macaulay duration#
Frederick Macaulay (1938) measured a bond’s “length” not by its maturity but by the present-value-weighted average time to its payments,
\[D = \frac{1}{P}\sum_i t_i \, c_i \, e^{-y t_i}.\]
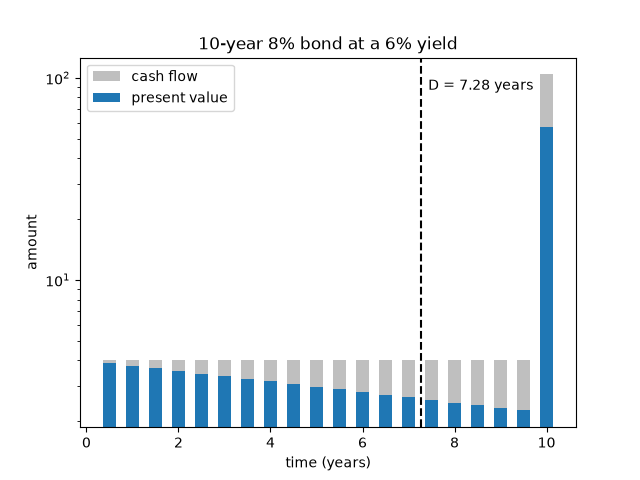
Drawn as bars of present value, the duration is the balance point of the bars. Coupons pull it in front of maturity: the higher the coupon, the shorter the bond.
import matplotlib.pyplot as plt
import numpy as np

from financialkit.fixed_income import bond_cash_flows, macaulay_duration
from financialkit.fixed_income.visualizers import plot_cash_flows
The duration is the fulcrum of the present-value bars#
y = 0.06
cf = bond_cash_flows(100.0, 0.08, 10.0, freq=2)
D = macaulay_duration(cf, y)
ax = plot_cash_flows(cf, y)
ax.axvline(D, color="k", ls="--")
ax.annotate(f"D = {D:.2f} years", (D, ax.get_ylim()[1] * 0.8), xytext=(5, 0), textcoords="offset points")
ax.set_title("10-year 8% bond at a 6% yield")
ax.set_yscale("log")
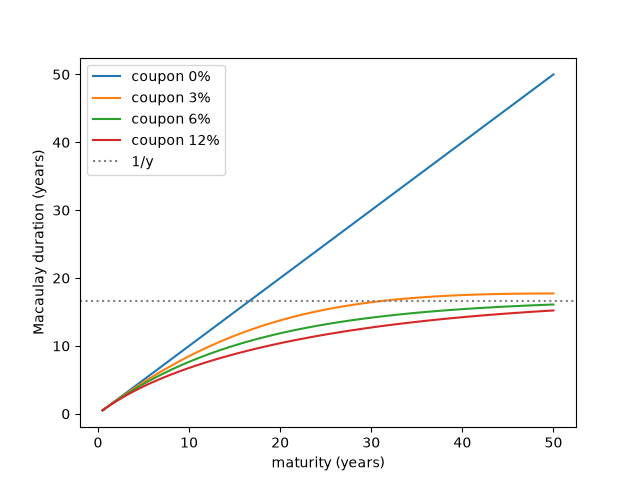
Duration against maturity for several coupons#
A zero-coupon bond’s duration is its maturity (the diagonal). Coupon bonds fall below it and level off near \(1/y\), Macaulay’s perpetuity limit for a continuously compounded yield.
maturities = np.linspace(0.5, 50, 100)
fig, ax = plt.subplots()
for c in (0.0, 0.03, 0.06, 0.12):
    ax.plot(maturities, [macaulay_duration(bond_cash_flows(100.0, c, T), y) for T in maturities], label=f"coupon {100 * c:.0f}%")
ax.axhline(1 / y, color="0.5", ls=":", label="1/y")
ax.set_xlabel("maturity (years)")
ax.set_ylabel("Macaulay duration (years)")
ax.legend()
plt.show()
Total running time of the script: (0 minutes 0.072 seconds)
