
Note
Go to the end to download the full example code or to run this example in your browser via JupyterLite.
Bierwag-Kaufman-Toevs: convexity#
Duration is a tangent, but the price-yield curve bends. Bierwag, Kaufman and Toevs (1983) brought the second-order term into portfolio practice:
\[\frac{\Delta P}{P} \approx -D_{mod}\,\Delta y + \tfrac12 C\,(\Delta y)^2,
\qquad C = \frac{1}{P}\frac{d^2P}{dy^2}.\]
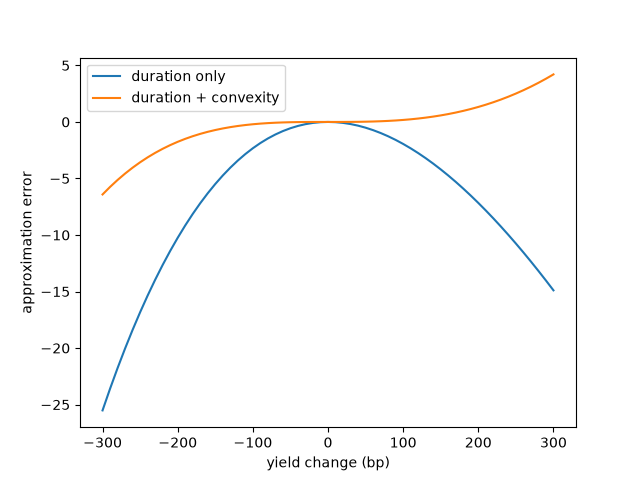
For a long bond the convexity term removes most of the duration approximation’s error, and a barbell of the same duration as a bullet is more convex.
import matplotlib.pyplot as plt
import numpy as np

from financialkit.fixed_income import CashFlows, bond_cash_flows, bond_risk, price_from_yield
from financialkit.fixed_income.visualizers import plot_price_yield

cf = bond_cash_flows(100.0, 0.04, 30.0)
plot_price_yield(cf, 0.04, dy=0.04).set_title("30-year 4% bond")
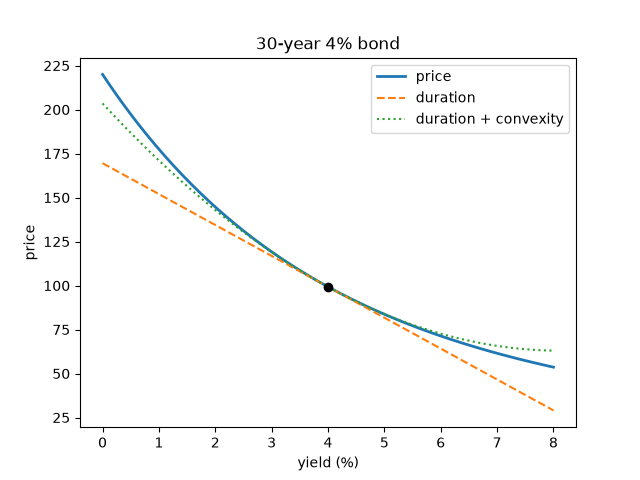
Text(0.5, 1.0, '30-year 4% bond')
Approximation errors#
risk = bond_risk(cf, 0.04)
dy = np.linspace(-0.03, 0.03, 61)
exact = price_from_yield(cf, 0.04 + dy) - risk.price
fig, ax = plt.subplots()
ax.plot(1e4 * dy, risk.price_change(dy, order=1) - exact, label="duration only")
ax.plot(1e4 * dy, risk.price_change(dy, order=2) - exact, label="duration + convexity")
ax.set_xlabel("yield change (bp)")
ax.set_ylabel("approximation error")
ax.legend()
<matplotlib.legend.Legend object at 0x116b0b770>
Bullet versus barbell of equal duration#
y = 0.04
bullet = CashFlows([10.0], [100.0])
w = 0.5  # half in 2-year, half in 18-year zeros: Macaulay duration 10
barbell = CashFlows([2.0, 18.0], [w * 100 * np.exp(-y * 8), (1 - w) * 100 * np.exp(y * 8)])
for name, port in (("bullet", bullet), ("barbell", barbell)):
    r = bond_risk(port, y)
    print(f"{name:8s} D={r.macaulay_duration:.3f}  C={r.convexity:.2f}")
plt.show()
bullet   D=10.000  C=100.00
barbell  D=10.000  C=164.00
Total running time of the script: (0 minutes 0.051 seconds)
