
Note
Go to the end to download the full example code or to run this example in your browser via JupyterLite.
The IBM-World Bank currency swap#
In August 1981 Salomon Brothers arranged for the World Bank to take over IBM’s Swiss franc and Deutsche mark debt payments, while IBM took over dollar payments from the World Bank. Each side got the currency it wanted without issuing new debt. A fixed-for-fixed currency swap is a long bond in one currency and a short bond in the other, so its value moves with the exchange rate and with both yield curves.
The figures below are illustrative, not the 1981 terms: the swap receives 6% on CHF 200 million and pays 15% on USD 100 million for five years.
import matplotlib.pyplot as plt
import numpy as np

from financialkit.fixed_income import currency_swap_value

usd_rate, chf_rate = np.log(1.15), np.log(1.06)
spot = 0.5  # USD per CHF at inception
v = currency_swap_value(usd_rate, chf_rate, spot, 100.0, 200.0, 0.15, 0.06, 5.0)
print(f"CHF leg {v.receive_leg:.3f} $m, USD leg {v.pay_leg:.3f} $m, value {v.value:.1e} $m (zero at inception)")
CHF leg 100.000 $m, USD leg 100.000 $m, value -4.3e-14 $m (zero at inception)
Value against the exchange rate#
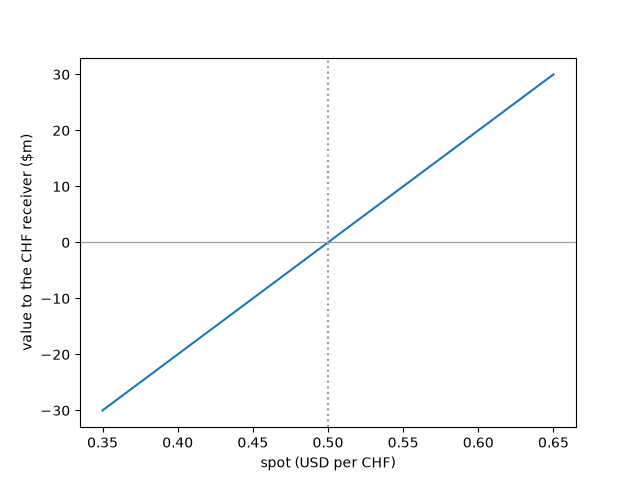
Both legs are par bonds at inception, so the swap starts at zero, and a stronger franc makes the franc receiver gain.
spots = np.linspace(0.35, 0.65, 61)
values = [currency_swap_value(usd_rate, chf_rate, s, 100.0, 200.0, 0.15, 0.06, 5.0).value for s in spots]
fig, ax = plt.subplots()
ax.plot(spots, values)
ax.axhline(0.0, color="0.6", lw=0.8)
ax.axvline(spot, color="0.6", ls=":")
ax.set_xlabel("spot (USD per CHF)")
ax.set_ylabel("value to the CHF receiver ($m)")
plt.show()
Total running time of the script: (0 minutes 0.022 seconds)
