
Note
Go to the end to download the full example code or to run this example in your browser via JupyterLite.
The plain-vanilla interest-rate swap#
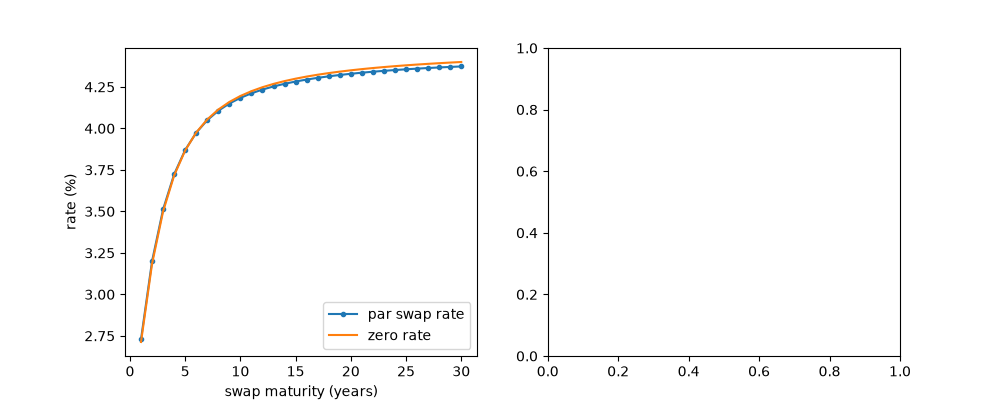
The single-currency swap followed within a year of the IBM-World Bank deal. One side pays a fixed rate and the other pays a floating rate on the same notional. The floating leg is worth par on every reset date, so the swap is worth a floating-rate note minus a fixed-coupon bond. The par swap rate is the coupon that makes the two equal.
import matplotlib.pyplot as plt
import numpy as np

from financialkit.fixed_income import NelsonSiegelCurve, ZeroCurve, interest_rate_swap_value, swap_rate
Hull’s Example 7.1#
curve = ZeroCurve([0.25, 0.75, 1.25], [0.10, 0.105, 0.11])
v = interest_rate_swap_value(curve, 100.0, 0.08, 1.25, pay_fixed=False, floating_rate=0.102)
print(f"fixed bond {v.receive_leg:.3f}, floating note {v.pay_leg:.3f}, swap to fixed receiver {v.value:.3f} ($m)")
fixed bond 98.238, floating note 102.505, swap to fixed receiver -4.267 ($m)
The par swap curve#
ns = NelsonSiegelCurve(0.045, -0.025, 0.01, 2.0)
T = np.arange(1, 31, dtype=float)
fig, axes = plt.subplots(1, 2, figsize=(10, 4))
axes[0].plot(T, 100 * swap_rate(ns, T), "o-", ms=3, label="par swap rate")
axes[0].plot(T, 100 * ns.zero_rate(T), label="zero rate")
axes[0].set_xlabel("swap maturity (years)")
axes[0].set_ylabel("rate (%)")
axes[0].legend()
<matplotlib.legend.Legend object at 0x116f0e120>
A 10-year payer swap after parallel moves#
K = swap_rate(ns, 10.0)
shifts = np.linspace(-0.02, 0.02, 41)
axes[1].plot(1e4 * shifts, [interest_rate_swap_value(ns.shifted(s), 100.0, K, 10.0).value for s in shifts])
axes[1].axhline(0.0, color="0.6", lw=0.8)
axes[1].set_xlabel("parallel shift (bp)")
axes[1].set_ylabel("value to fixed payer per 100")
plt.show()
Total running time of the script: (0 minutes 0.035 seconds)
