
Note
Go to the end to download the full example code or to run this example in your browser via JupyterLite.
Brace-Gatarek-Musiela: caps and floors by Black’s formula#
Traders priced each caplet with Black’s formula on its forward LIBOR rate long before anyone could say which model justified it. Alan Brace, Dariusz Gatarek and Marek Musiela (1997), with Miltersen, Sandmann and Sondermann, built that model: under the measure that uses the payment bond as numeraire, the simple forward rate \(F_k = [P(0, t_k)/P(0, t_{k+1}) - 1]/\tau\) is a martingale, and if it is lognormal
A cap is the strip of caplets; cap minus floor is a swap.
import matplotlib.pyplot as plt
import numpy as np

from financialkit.fixed_income import NelsonSiegelCurve
from financialkit.interest_rate_models import HullWhiteModel, cap_floor_price, model_cap_floor_price
from financialkit.interest_rate_models.visualizers import plot_caplets
from financialkit.options import implied_volatility

curve = NelsonSiegelCurve(0.05, -0.02, 0.01, 2.0)
A 5-year quarterly cap as a strip of caplets#
vols = np.linspace(0.30, 0.20, 19)  # caplet volatilities decline with expiry
cap = cap_floor_price(curve, 0.045, 5.0, vols, freq=4, notional=1e6)
floor = cap_floor_price(curve, 0.045, 5.0, vols, freq=4, kind="floor", notional=1e6)
fig, axes = plt.subplots(1, 3, figsize=(15, 4))
plot_caplets(cap, ax=axes[0])
axes[0].set_title(f"cap {cap.price:,.0f}, floor {floor.price:,.0f}")

tau = cap.payment_times - cap.reset_times
swap = 1e6 * np.sum(tau * curve.discount(cap.payment_times) * (cap.forwards - 0.045))
print(f"cap - floor = {cap.price - floor.price:,.2f}; forward-start swap = {swap:,.2f}")
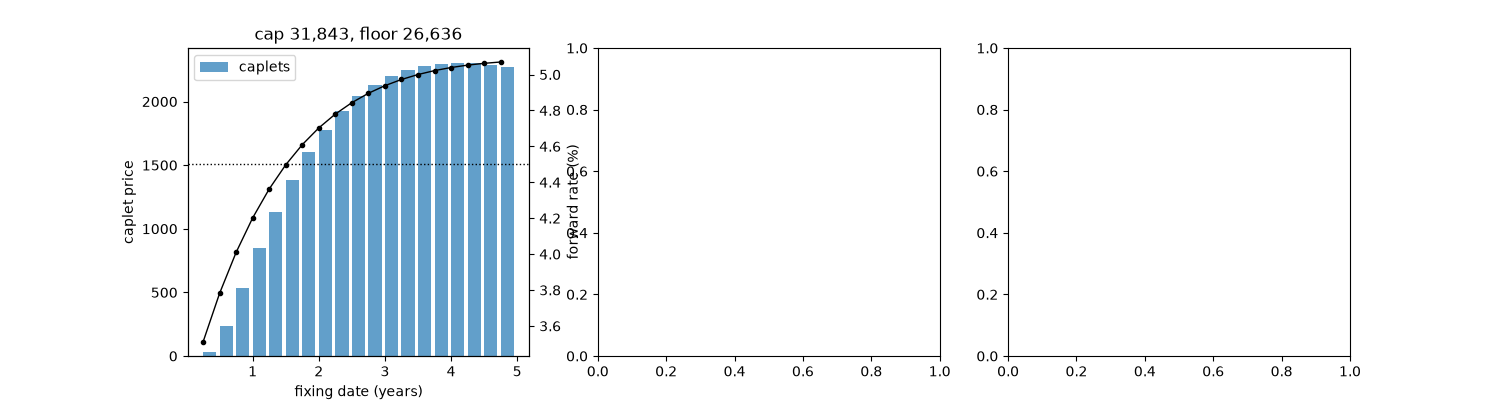
cap - floor = 5,207.00; forward-start swap = 5,207.00
Cap prices across strikes#
K = np.linspace(0.02, 0.08, 25)
axes[1].plot(100 * K, [cap_floor_price(curve, k, 5.0, 0.25, freq=4).price for k in K], label="cap")
axes[1].plot(100 * K, [cap_floor_price(curve, k, 5.0, 0.25, freq=4, kind="floor").price for k in K], label="floor")
axes[1].set_xlabel("strike (%)")
axes[1].set_ylabel("price per unit notional")
axes[1].legend()
<matplotlib.legend.Legend object at 0x11a4fd550>
The caplet volatilities a Hull-White model implies#
In Hull-White a caplet is a put on a zero-coupon bond. Inverting Black’s formula on those prices gives the caplet volatility curve the model would quote.
for a in (0.01, 0.1, 0.3):
    hw = model_cap_floor_price(HullWhiteModel(curve, a, 0.01), 0.045, 5.0, freq=4)
    t1, t2 = hw.reset_times, hw.payment_times
    undiscounted = hw.caplets / ((t2 - t1) * curve.discount(t2))
    iv = implied_volatility(undiscounted, hw.forwards, 0.045, t1, 0.0, 0.0)
    axes[2].plot(t1, 100 * iv, "o-", ms=3, label=f"a = {a}")
axes[2].set_xlabel("caplet expiry (years)")
axes[2].set_ylabel("Black caplet volatility (%)")
axes[2].legend(title="Hull-White, sigma = 1%")
fig.tight_layout()

plt.show()
Total running time of the script: (0 minutes 0.102 seconds)
