
Note
Go to the end to download the full example code or to run this example in your browser via JupyterLite.
Stoll’s put-call parity#
Hans Stoll (1969) showed that a European call, a put and the stock are tied together with no model at all: buying a call and selling a put with the same strike and maturity replicates a forward, so
\[c - p = S e^{-qT} - K e^{-rT}.\]
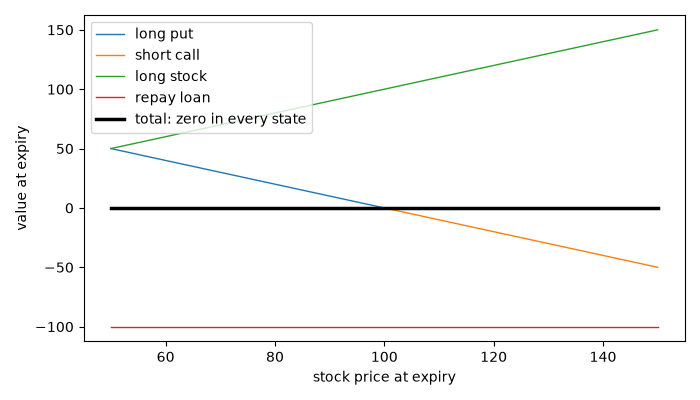
A pair that breaks the relation is an arbitrage: the conversion (long stock, long put, short call) locks in the residual.
import matplotlib.pyplot as plt
import numpy as np

from financialkit.options import black_scholes_price, parity_residual, put_call_parity
Parity holds strike by strike, whatever the volatility#
S, T, r, q = 100.0, 0.5, 0.05, 0.02
K = np.linspace(70, 130, 7)
for sigma in (0.1, 0.3, 0.8):
    c = black_scholes_price(S, K, T, r, sigma, q)
    p = black_scholes_price(S, K, T, r, sigma, q, option_type="put")
    print(f"sigma = {sigma:.1f}: max |c - p - (S e^-qT - K e^-rT)| = {np.max(np.abs(parity_residual(c, p, S, K, T, r, q))):.1e}")
sigma = 0.1: max |c - p - (S e^-qT - K e^-rT)| = 3.6e-14
sigma = 0.3: max |c - p - (S e^-qT - K e^-rT)| = 2.7e-14
sigma = 0.8: max |c - p - (S e^-qT - K e^-rT)| = 1.4e-14
Exploiting a mispriced put#
Quote the put 0.40 too cheap and run a reversal: buy the put, sell the call, buy the stock and borrow the present value of the strike. At expiry the position is worth exactly zero in every state, so its initial cash flow is pure profit.
c = black_scholes_price(S, 100.0, T, r, 0.25, q)
p_fair = put_call_parity(c, S, 100.0, T, r, q)
p_quoted = p_fair - 0.40
profit = c - p_quoted - S * np.exp(-q * T) + 100.0 * np.exp(-r * T)
print(f"fair put {p_fair:.4f}, quoted {p_quoted:.4f}, locked-in profit {profit:.4f}")

S_T = np.linspace(50, 150, 201)
legs = {
    "long put": np.maximum(100.0 - S_T, 0.0),
    "short call": -np.maximum(S_T - 100.0, 0.0),
    "long stock": S_T,
    "repay loan": -100.0 * np.ones_like(S_T),
}
fig, ax = plt.subplots(figsize=(7, 4))
for name, value in legs.items():
    ax.plot(S_T, value, lw=1, label=name)
ax.plot(S_T, sum(legs.values()), "k", lw=2.5, label="total: zero in every state")
ax.set_xlabel("stock price at expiry")
ax.set_ylabel("value at expiry")
ax.legend()
fig.tight_layout()

plt.show()
fair put 6.2090, quoted 5.8090, locked-in profit 0.4000
Total running time of the script: (0 minutes 0.042 seconds)
