
Note
Go to the end to download the full example code or to run this example in your browser via JupyterLite.
The Rendleman-Bartter tree#
Richard Rendleman and Brit Bartter (1979) published the two-state model in the same year as Cox, Ross and Rubinstein, but centred each step on the drift instead of on today’s price:
\[\ln u, \ln d = (r - \tfrac12\sigma^2)\Delta t \pm \sigma\sqrt{\Delta t}.\]
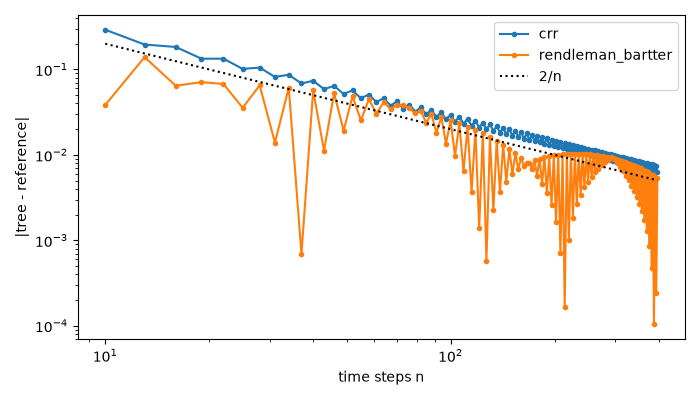
The up and down moves are then (nearly) equally likely, and the tree drifts with the stock instead of staying centred on the spot. Both trees converge to Black-Scholes at the same \(1/n\) rate.
import matplotlib.pyplot as plt
import numpy as np

from financialkit.options import CRRTree, RendlemanBartterTree, black_scholes_price
from financialkit.options.visualizers import plot_tree_convergence

S, K, T, r, sigma = 100.0, 100.0, 1.0, 0.08, 0.3
Nearly equal probabilities, a drifting lattice#
for tree in (CRRTree(10), RendlemanBartterTree(10)):
    u, d, p, _ = tree._parameters(S, K, T, r, sigma, 0.0, 10)
    print(f"{tree.method:>17}: u = {u:.4f}, d = {d:.4f}, p = {p:.4f}, centre after 10 steps = {S * u**5 * d**5:.2f}")

fig, axes = plt.subplots(1, 2, figsize=(11, 4))
for ax, tree in zip(axes, (CRRTree(6), RendlemanBartterTree(6)), strict=True):
    u, d, _, n = tree._parameters(S, K, T, r, sigma, 0.0, 6)
    for i in range(n + 1):
        j = np.arange(i + 1)
        ax.plot(np.full(i + 1, i * T / n), S * u**j * d ** (i - j), "o", color="C0", ms=4)
    ax.axhline(S, color="k", lw=0.5)
    ax.set_title(f"{tree.method} nodes")
    ax.set_xlabel("time")
axes[0].set_ylabel("stock price")
fig.tight_layout()
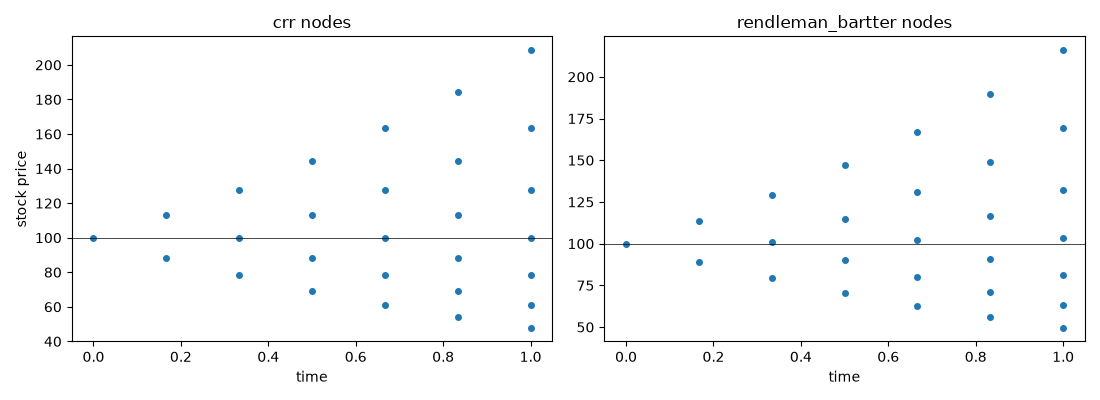
              crr: u = 1.0995, d = 0.9095, p = 0.5186, centre after 10 steps = 100.00
rendleman_bartter: u = 1.1034, d = 0.9127, p = 0.5000, centre after 10 steps = 103.56
Convergence of both trees#
exact = black_scholes_price(S, K, T, r, sigma)
steps = np.arange(10, 400, 3)
fig, ax = plt.subplots(figsize=(7, 4))
for tree in (CRRTree, RendlemanBartterTree):
    prices = [tree(n).price(S, K, T, r, sigma).price for n in steps]
    plot_tree_convergence(steps, prices, exact, ax=ax, label=tree.method)
ax.loglog(steps, 2.0 / steps, "k:", label="2/n")
ax.legend()
fig.tight_layout()

plt.show()
Total running time of the script: (0 minutes 0.270 seconds)
