
Note
Go to the end to download the full example code or to run this example in your browser via JupyterLite.
De Witt’s life annuities#
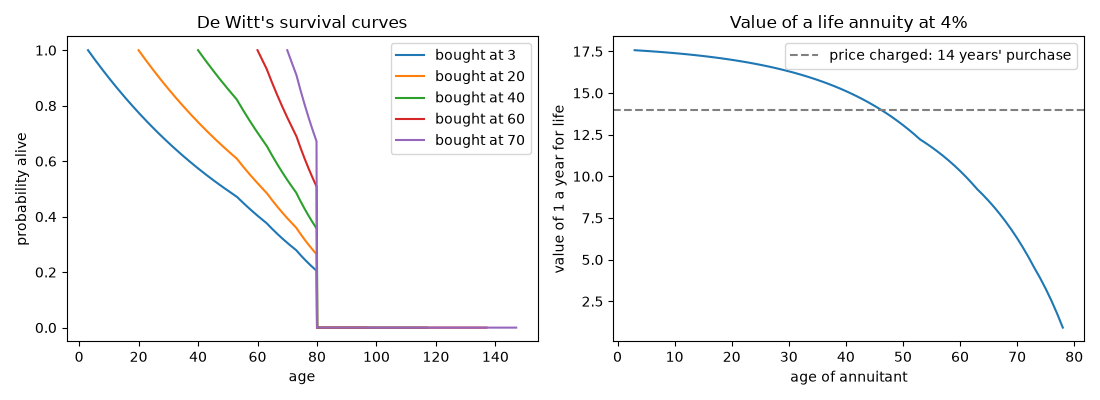
In 1671 Johan de Witt, Grand Pensionary of Holland, sent the States General his Waerdye van Lyf-renten, arguing that the life annuities the province sold at 14 years’ purchase were too cheap. He valued an annuity as the sum of each payment, discounted at 4% and weighted by the chance that the buyer is still alive to receive it, under a simple mortality hypothesis: an equal chance of death in every half-year up to age 53, rising to 1.5, 2 and 3 times that in the bands 53-63, 63-73 and 73-80.
import matplotlib.pyplot as plt
import numpy as np

from financialkit.time_value import annuity_factor, de_witt_survival, life_annuity_value
Survival and the value of a life annuity#
Annual payments of 1 florin, discounted at 4%.
ages = [3, 20, 40, 60, 70]
k = np.arange(1, 78)
for age in ages:
    p = de_witt_survival(age, k, base_hazard=0.015)
    print(f"age {age:2d}: life annuity worth {life_annuity_value(1.0, 0.04, p):5.2f} years' purchase")
print(f"perpetual annuity-certain at 4%: {annuity_factor(0.04, 10_000):.2f}")
age  3: life annuity worth 17.57 years' purchase
age 20: life annuity worth 16.99 years' purchase
age 40: life annuity worth 15.11 years' purchase
age 60: life annuity worth 10.32 years' purchase
age 70: life annuity worth  6.28 years' purchase
perpetual annuity-certain at 4%: 25.00
The ingredients#
fig, axes = plt.subplots(1, 2, figsize=(11, 4))
t = np.linspace(0.0, 77.0, 400)
for age in ages:
    axes[0].plot(age + t, de_witt_survival(age, t, base_hazard=0.015), label=f"bought at {age}")
axes[0].set_xlabel("age")
axes[0].set_ylabel("probability alive")
axes[0].set_title("De Witt's survival curves")
axes[0].legend()

buy_ages = np.arange(3, 79)
values = [life_annuity_value(1.0, 0.04, de_witt_survival(a, k, base_hazard=0.015)) for a in buy_ages]
axes[1].plot(buy_ages, values)
axes[1].axhline(14.0, color="gray", ls="--", label="price charged: 14 years' purchase")
axes[1].set_xlabel("age of annuitant")
axes[1].set_ylabel("value of 1 a year for life")
axes[1].set_title("Value of a life annuity at 4%")
axes[1].legend()
fig.tight_layout()

plt.show()
Total running time of the script: (0 minutes 0.083 seconds)
