
Note
Go to the end to download the full example code or to run this example in your browser via JupyterLite.
Price’s sinking fund#
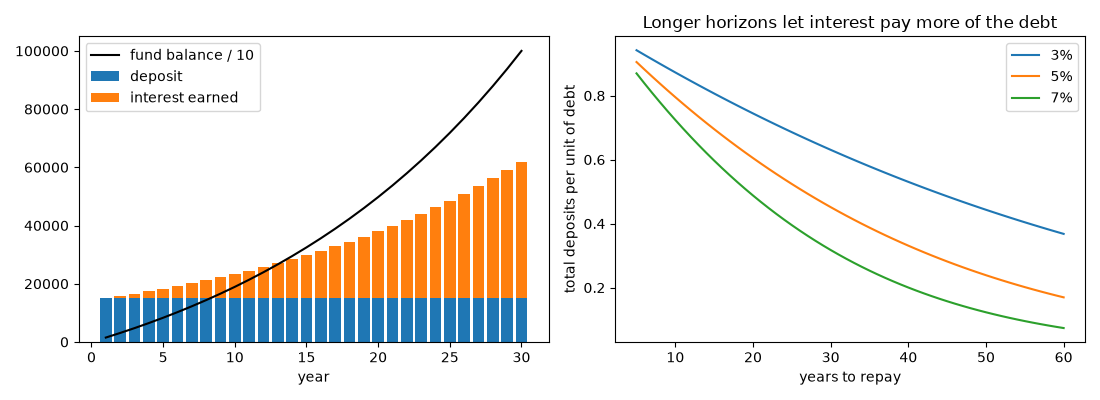
In An Appeal to the Public on the Subject of the National Debt (1772) Richard Price showed what compound interest could do for a nation in debt: a fixed sum set aside every year and left to accumulate at interest would grow to repay the debt. The level deposit that reaches a target \(F\) in \(n\) periods is \(F / s_{\overline{n}|}\). Pitt’s sinking fund of 1786 put the idea into practice.
import matplotlib.pyplot as plt
import numpy as np

from financialkit.time_value import sinking_fund_payment, sinking_fund_schedule
Repaying a debt of 1,000,000 in 30 years at 5%#
s = sinking_fund_schedule(1_000_000.0, 0.05, 30)
print(f"annual deposit: {s.deposit:,.0f}")
print(f"total deposited: {30 * s.deposit:,.0f}; interest earned: {s.interest.sum():,.0f}")
annual deposit: 15,051
total deposited: 451,543; interest earned: 548,457
How interest does the work#
fig, axes = plt.subplots(1, 2, figsize=(11, 4))
deposits = np.full(30, s.deposit)
axes[0].bar(s.periods, deposits, label="deposit")
axes[0].bar(s.periods, s.interest, bottom=deposits, label="interest earned")
axes[0].plot(s.periods, s.balance / 10, "k", label="fund balance / 10")
axes[0].set_xlabel("year")
axes[0].legend()

n = np.arange(5, 61)
for r in (0.03, 0.05, 0.07):
    axes[1].plot(n, sinking_fund_payment(1_000_000.0, r, n) * n / 1e6, label=f"{r:.0%}")
axes[1].set_xlabel("years to repay")
axes[1].set_ylabel("total deposits per unit of debt")
axes[1].set_title("Longer horizons let interest pay more of the debt")
axes[1].legend()
fig.tight_layout()

plt.show()
Total running time of the script: (0 minutes 0.074 seconds)
