
Note
Go to the end to download the full example code or to run this example in your browser via JupyterLite.
Romberg integration: extrapolating the trapezoidal rule#
Prints the Romberg table for the integral of 4/(1 + x^2) over [0, 1], which equals pi. Each column applies one more Richardson extrapolation to the halved trapezoidal rules in the first column.
import matplotlib.pyplot as plt
import numpy as np

from mathematicskit.calculus import RombergQuadrature
The Romberg table#
def f(x):
    return 4.0 / (1.0 + x**2)


result = RombergQuadrature(levels=5).integrate(f, 0.0, 1.0)
for i, row in enumerate(result.extra["table"]):
    print(f"n = {2**i:3d}: " + "  ".join(f"{v:.10f}" for v in row))
print(f"estimate {result.value:.14f}, pi = {np.pi:.14f}")
n =   1: 3.0000000000
n =   2: 3.1000000000  3.1333333333
n =   4: 3.1311764706  3.1415686275  3.1421176471
n =   8: 3.1389884945  3.1415925025  3.1415940941  3.1415857838
n =  16: 3.1409416120  3.1415926512  3.1415926611  3.1415926384  3.1415926653
n =  32: 3.1414298932  3.1415926536  3.1415926537  3.1415926536  3.1415926536  3.1415926536
estimate 3.14159265363824, pi = 3.14159265358979
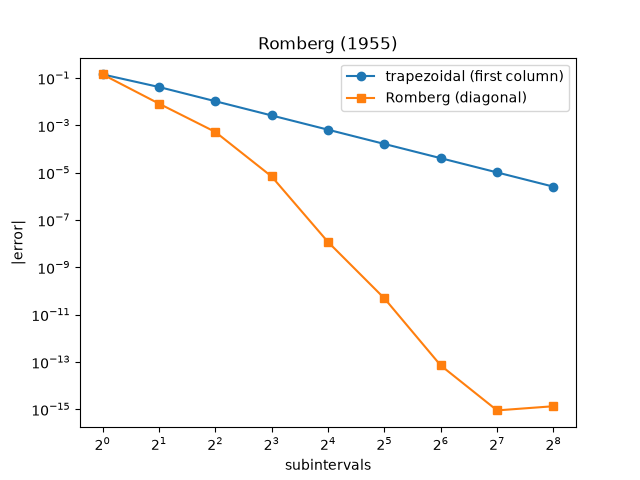
First column against the diagonal#
table = RombergQuadrature(levels=8).integrate(f, 0.0, 1.0).extra["table"]
ns = [2**i for i in range(len(table))]
fig, ax = plt.subplots()
ax.semilogy(ns, [abs(row[0] - np.pi) for row in table], "o-", label="trapezoidal (first column)")
ax.semilogy(ns, [max(abs(row[-1] - np.pi), 1e-17) for row in table], "s-", label="Romberg (diagonal)")
ax.set_xscale("log", base=2)
ax.set_xlabel("subintervals")
ax.set_ylabel("|error|")
ax.legend()
ax.set_title("Romberg (1955)")
Text(0.5, 1.0, 'Romberg (1955)')
Total running time of the script: (0 minutes 0.046 seconds)
