
Note
Go to the end to download the full example code or to run this example in your browser via JupyterLite.
The Weierstrass function: continuous, nowhere differentiable#
Plots the Weierstrass function sum a^n cos(b^n pi x) at several zoom levels. The graph looks equally rough at every scale, difference quotients grow without bound as the step shrinks, and the graph’s measured length keeps growing as it is sampled more finely.
import matplotlib.pyplot as plt
import numpy as np

from mathematicskit.fractals_chaos import weierstrass_function
Zooming in never smooths the graph#
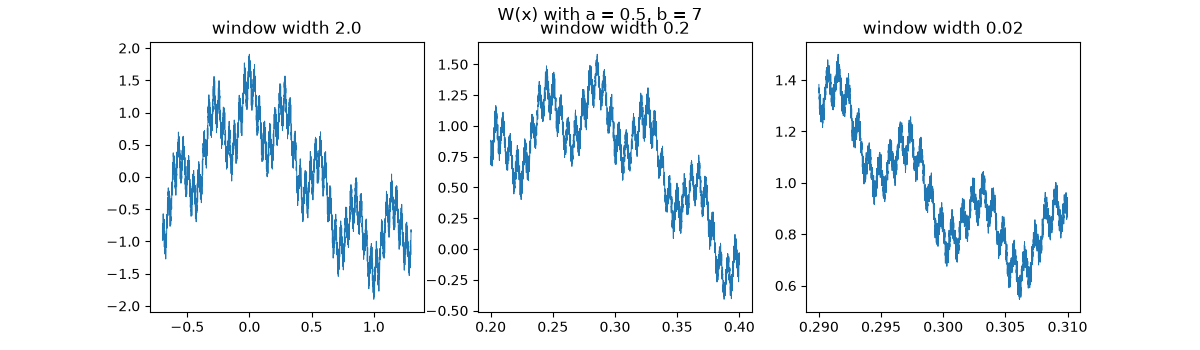
Text(0.5, 0.98, 'W(x) with a = 0.5, b = 7')
Difference quotients diverge#
for h in (1e-1, 1e-2, 1e-3, 1e-4, 1e-5):
    slope = (weierstrass_function(0.3 + h) - weierstrass_function(0.3)) / h
    print(f"h = {h:.0e}: difference quotient {float(slope):12.2f}")
h = 1e-01: difference quotient        -9.78
h = 1e-02: difference quotient         5.53
h = 1e-03: difference quotient      -119.59
h = 1e-04: difference quotient      -504.59
h = 1e-05: difference quotient      1190.24
The graph has infinite length#
   1000 samples: polygonal length of the graph over [0, 1] =     96.8
  10000 samples: polygonal length of the graph over [0, 1] =    343.7
 100000 samples: polygonal length of the graph over [0, 1] =   2101.0
1000000 samples: polygonal length of the graph over [0, 1] =  10109.4
Total running time of the script: (0 minutes 0.237 seconds)
