
Note
Go to the end to download the full example code or to run this example in your browser via JupyterLite.
Hilbert’s space-filling curve#
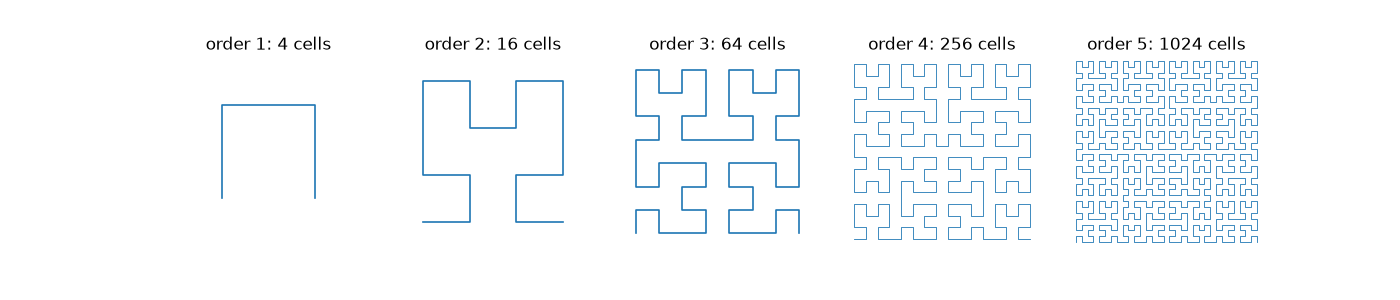
Draws the first few Hilbert curves, each visiting every cell of a finer grid. In the limit the curve passes through every point of the square while keeping nearby points of the curve close in the plane.
import matplotlib.pyplot as plt

from mathematicskit.fractals_chaos import hilbert_curve
Orders 1 to 5#
fig, axes = plt.subplots(1, 5, figsize=(14, 3))
for ax, order in zip(axes, range(1, 6), strict=False):
    pts = hilbert_curve(order)
    n = 2**order
    ax.plot((pts[:, 0] + 0.5) / n, (pts[:, 1] + 0.5) / n, lw=1.2 if order < 4 else 0.6)
    ax.set_aspect("equal")
    ax.set_xlim(0, 1)
    ax.set_ylim(0, 1)
    ax.set_title(f"order {order}: {len(pts)} cells")
    ax.axis("off")
Locality: nearby indices map to nearby cells#
order 6: 4096 cells, every step moves to a neighbouring cell: True
Total running time of the script: (0 minutes 0.035 seconds)
