
Note
Go to the end to download the full example code or to run this example in your browser via JupyterLite.
Euclid’s Elements, Book I: equal areas between parallels#
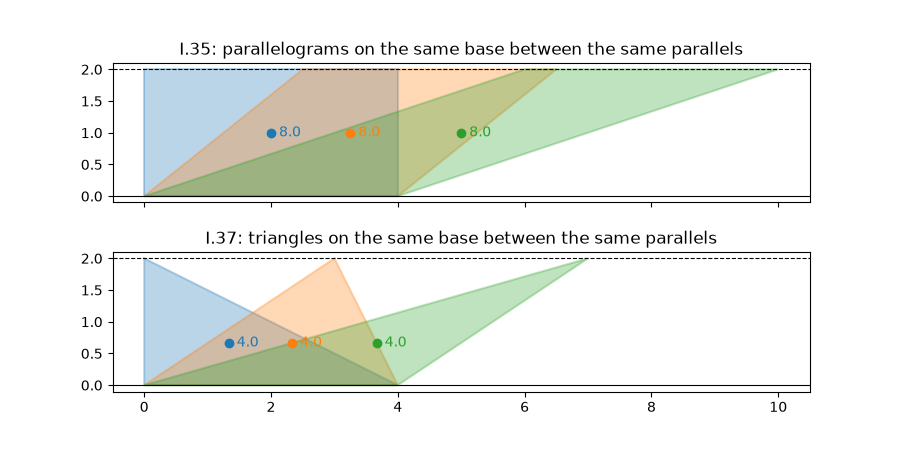
Euclid’s theory of area (Elements I.35-41) rests on two facts:
parallelograms on the same base and between the same parallels are
equal in area (I.35), and so are triangles (I.37), each triangle being
half of the parallelogram (I.41). Sliding the top side along its
parallel line changes every shape but, as the shoelace formula in
polygon_area() confirms, never the area.
import matplotlib.pyplot as plt
import numpy as np

from mathematicskit.geometry import polygon_area, polygon_centroid
Parallelograms on one base between two parallels (I.35)#
The base runs from (0, 0) to (4, 0); the opposite side lies on the parallel line y = 2, shifted sideways by different amounts.
base, height = 4.0, 2.0
shifts = [0.0, 2.5, 6.0]
parallelograms = [np.array([[0, 0], [base, 0], [base + s, height], [s, height]]) for s in shifts]
for s, quad in zip(shifts, parallelograms, strict=False):
    cx, cy = polygon_centroid(quad)
    print(f"shift {s:3.1f}: area {polygon_area(quad):.6f}, centroid ({cx:.2f}, {cy:.2f})")
print(f"base x height = {base * height:.6f}")
shift 0.0: area 8.000000, centroid (2.00, 1.00)
shift 2.5: area 8.000000, centroid (3.25, 1.00)
shift 6.0: area 8.000000, centroid (5.00, 1.00)
base x height = 8.000000
Triangles on the same base, half the parallelogram (I.37, I.41)#
apex at x = 0.0: area 4.000000 (half of 8.0)
apex at x = 3.0: area 4.000000 (half of 8.0)
apex at x = 7.0: area 4.000000 (half of 8.0)
The figures#
Every centroid lies on the midline y = h/2 for the parallelograms and y = h/3 for the triangles: the shapes shear, their areas do not change.
fig, (ax1, ax2) = plt.subplots(2, 1, figsize=(9, 4.5), sharex=True)
colors = ["tab:blue", "tab:orange", "tab:green"]
for ax, shapes, title in [(ax1, parallelograms, "I.35: parallelograms"), (ax2, triangles, "I.37: triangles")]:
    ax.axhline(0, color="k", lw=0.8)
    ax.axhline(height, color="k", lw=0.8, ls="--")
    for shape, color in zip(shapes, colors, strict=False):
        ax.fill(*shape.T, color=color, alpha=0.3, ec=color, lw=1.5)
        ax.plot(*polygon_centroid(shape), "o", color=color)
        ax.text(*polygon_centroid(shape), f"  {polygon_area(shape):.1f}", color=color, va="center")
    ax.set_aspect("equal")
    ax.set_title(f"{title} on the same base between the same parallels")
plt.show()
Total running time of the script: (0 minutes 0.040 seconds)
