
Note
Go to the end to download the full example code or to run this example in your browser via JupyterLite.
Voronoi diagrams: every location goes to its nearest site#
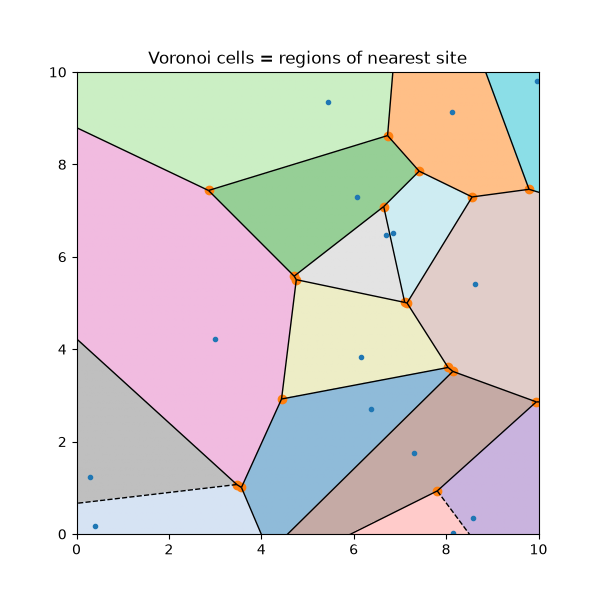
Partitions the plane around a set of sites so that each region holds
every location closer to its site than to any other. Colouring a fine
grid by nearest site reproduces exactly the cells that
voronoi_diagram() computes, and each
Voronoi vertex is equidistant from the three sites whose cells meet
there.
import matplotlib.pyplot as plt
import numpy as np

from mathematicskit.geometry import voronoi_diagram
from mathematicskit.geometry.visualizers.plots import plot_voronoi
Sites and their Voronoi diagram#
rng = np.random.default_rng(0)
sites = rng.uniform(0, 10, size=(15, 2))
result = voronoi_diagram(sites)
print(f"{sites.shape[0]} sites, {result.vertices.shape[0]} Voronoi vertices, {result.ridge_points.shape[0]} ridges")
15 sites, 22 Voronoi vertices, 36 ridges
Each vertex is equidistant from three sites#
A Voronoi vertex is where three cells meet, so it is the same distance from the three nearest sites.
dists = np.sort(np.linalg.norm(result.vertices[:, None, :] - sites[None, :, :], axis=2), axis=1)
spread = np.max(dists[:, 2] - dists[:, 0])
print(f"largest gap between a vertex's three nearest-site distances: {spread:.2e}")
largest gap between a vertex's three nearest-site distances: 3.55e-15
Nearest-site colouring matches the cells#
xs = np.linspace(0, 10, 400)
X, Y = np.meshgrid(xs, xs)
grid = np.column_stack([X.ravel(), Y.ravel()])
nearest = np.argmin(np.linalg.norm(grid[:, None, :] - sites[None, :, :], axis=2), axis=1)

fig, ax = plt.subplots(figsize=(6, 6))
ax.imshow(nearest.reshape(X.shape), origin="lower", extent=(0, 10, 0, 10), cmap="tab20", alpha=0.5)
plot_voronoi(sites, ax=ax)
ax.set_xlim(0, 10)
ax.set_ylim(0, 10)
ax.set_aspect("equal")
ax.set_title("Voronoi cells = regions of nearest site")
plt.show()
Total running time of the script: (0 minutes 0.063 seconds)
