
Note
Go to the end to download the full example code or to run this example in your browser via JupyterLite.
The Viterbi algorithm (1967)#
Viterbi decoded convolutional codes by dynamic programming on the trellis of encoder states: at every step each state keeps only its best incoming path, so maximum-likelihood decoding costs time linear in the message length instead of exponential. It went on to decode deep-space probes, mobile phones, and hidden Markov models.
import matplotlib.pyplot as plt
import numpy as np

from mathematicskit.information_theory import bsc_transmit, convolutional_encode, viterbi_decode

message = np.array([1, 0, 1, 1, 0, 0, 1, 0, 1, 1])
received = convolutional_encode(message)
received[[3, 12]] ^= 1
print("decoded with 2 channel errors:", viterbi_decode(received), "\nmessage:                       ", message)
decoded with 2 channel errors: [1 0 1 1 0 0 1 0 1 1]
message:                        [1 0 1 1 0 0 1 0 1 1]
The trellis and the surviving path#
states = []
state = 0
for b in [*message, 0, 0]:
    states.append(state)
    state = ((b << 2) | state) >> 1
states.append(state)
fig, (ax1, ax2) = plt.subplots(1, 2, figsize=(12, 4))
for t in range(len(states) - 1):
    for s in range(4):
        for b in (0, 1):
            ax1.plot([t, t + 1], [s, ((b << 2) | s) >> 1], color="0.85", lw=1, zorder=1)
ax1.plot(range(len(states)), states, "o-", color="C3", lw=2, zorder=2)
ax1.set_yticks(range(4), ["00", "01", "10", "11"])
ax1.set_xlabel("time")
ax1.set_ylabel("encoder state")
ax1.set_title("Trellis of the (7,5) code, decoded path in red")
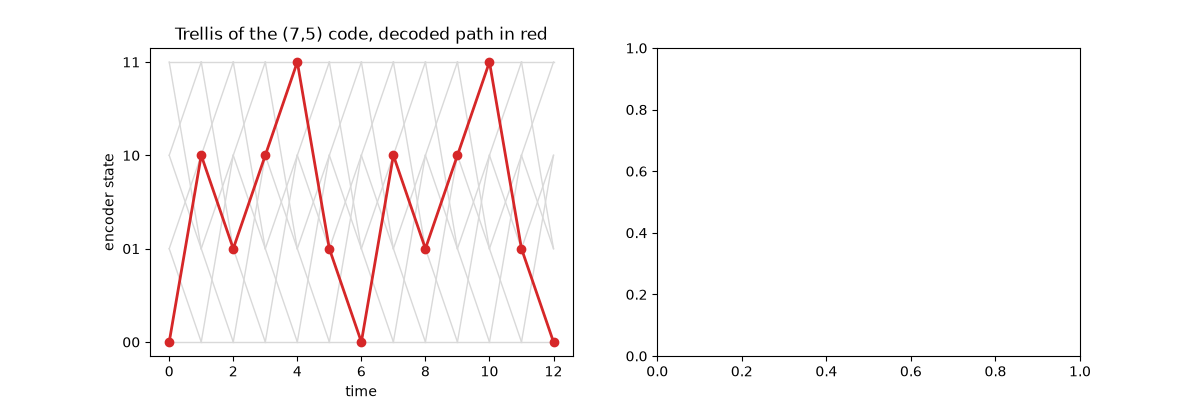
Text(0.5, 1.0, 'Trellis of the (7,5) code, decoded path in red')
Bit error rate against the uncoded channel#
rng = np.random.default_rng(0)
ps = np.logspace(-2.5, -0.9, 9)
bits = rng.integers(0, 2, 20_000)
ber = np.array([np.mean(viterbi_decode(bsc_transmit(convolutional_encode(bits), p, seed=rng)) != bits) for p in ps])
seen = ber > 0  # no errors at all in 20 000 bits leaves nothing to plot on a log scale
ax2.loglog(ps[seen], ber[seen], "o-", label="Viterbi-decoded (7,5) code")
ax2.loglog(ps, ps, "k--", label="uncoded")
ax2.set_xlabel("crossover probability p")
ax2.set_ylabel("bit error rate")
ax2.legend()
<matplotlib.legend.Legend object at 0x113685a90>
Total running time of the script: (0 minutes 1.540 seconds)
