
Note
Go to the end to download the full example code or to run this example in your browser via JupyterLite.
Mutual information (1948)#
Shannon measured what the output \(Y\) of a noisy channel tells about its input \(X\) by \(I(X;Y) = H(X) - H(X\mid Y)\), the uncertainty removed by observing the output. The information diagram shows the decomposition for a binary symmetric channel, and the curve shows \(I(X;Y)\) against the input bias for several noise levels.
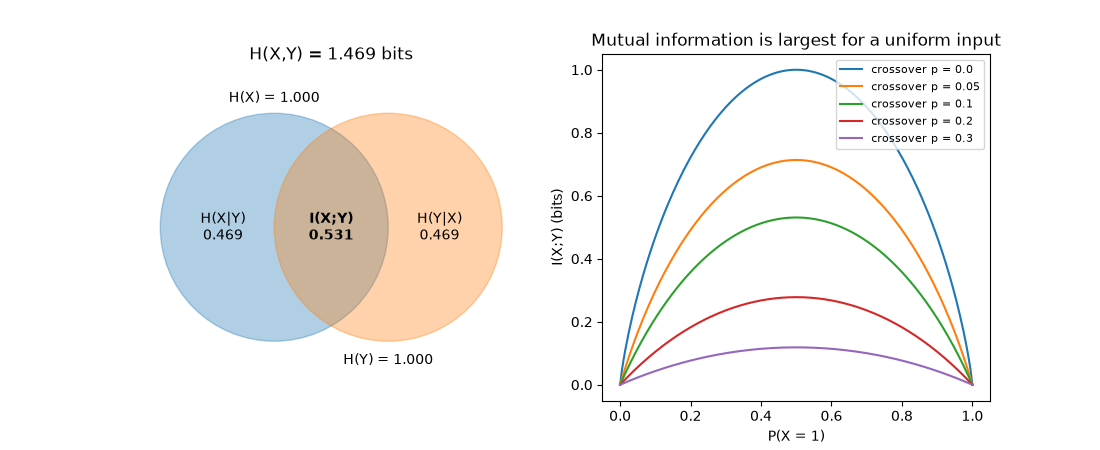
<matplotlib.legend.Legend object at 0x11356aa50>
import matplotlib.pyplot as plt
import numpy as np

from mathematicskit.information_theory import mutual_information
from mathematicskit.information_theory.visualizers import plot_information_diagram


def bsc_joint(q, p):
    """Joint distribution of input X ~ Bernoulli(q) and the BSC(p) output Y."""
    return np.array([[(1 - q) * (1 - p), (1 - q) * p], [q * p, q * (1 - p)]])


fig, (ax1, ax2) = plt.subplots(1, 2, figsize=(11, 4.5))
plot_information_diagram(bsc_joint(0.5, 0.1), ax=ax1)

q = np.linspace(0, 1, 201)
for p in (0.0, 0.05, 0.1, 0.2, 0.3):
    ax2.plot(q, [mutual_information(bsc_joint(qi, p)) for qi in q], label=f"crossover p = {p}")
ax2.set_xlabel("P(X = 1)")
ax2.set_ylabel("I(X;Y) (bits)")
ax2.set_title("Mutual information is largest for a uniform input")
ax2.legend(fontsize=8)
Total running time of the script: (0 minutes 0.230 seconds)
