
Note
Go to the end to download the full example code or to run this example in your browser via JupyterLite.
IEEE 754: bit layouts, machine epsilon, and the spacing of floats#
The IEEE 754 standard of 1985 fixed how a binary floating-point number is stored: a sign bit, a biased exponent, and a fraction, with value \((-1)^s (1.f)_2 \cdot 2^{e}\). It also fixed the rounding rule (round to nearest, ties to even) and the special values (signed zeros, subnormals, infinities, NaN). Machine epsilon, the gap between 1 and the next float, is \(2^{-52}\) in double precision. Floats are equally spaced within each binade \([2^e, 2^{e+1})\), and the spacing doubles from one binade to the next, so their relative spacing stays roughly constant.
import matplotlib.pyplot as plt
import numpy as np

from mathematicskit.numerical_analysis import float_bits, machine_epsilon, toy_float_system, ulp
Decoding the bit fields#
for x in (1.0, 0.1, -2.5, 5e-324):
    b = float_bits(x)
    print(f"{x!r:>8}: sign {b.sign} | exponent {b.exponent_bits} (2^{b.exponent}) | fraction {b.fraction_bits[:16]}... | {b.category}")
for dtype in (np.float16, np.float32, np.float64):
    print(f"{np.dtype(dtype).name:>8}: machine epsilon {machine_epsilon(dtype):.3e} = 2^{int(np.log2(machine_epsilon(dtype)))}")

fig, axes = plt.subplots(3, 1, figsize=(10, 9), gridspec_kw={"height_ratios": [1, 1.2, 2]})

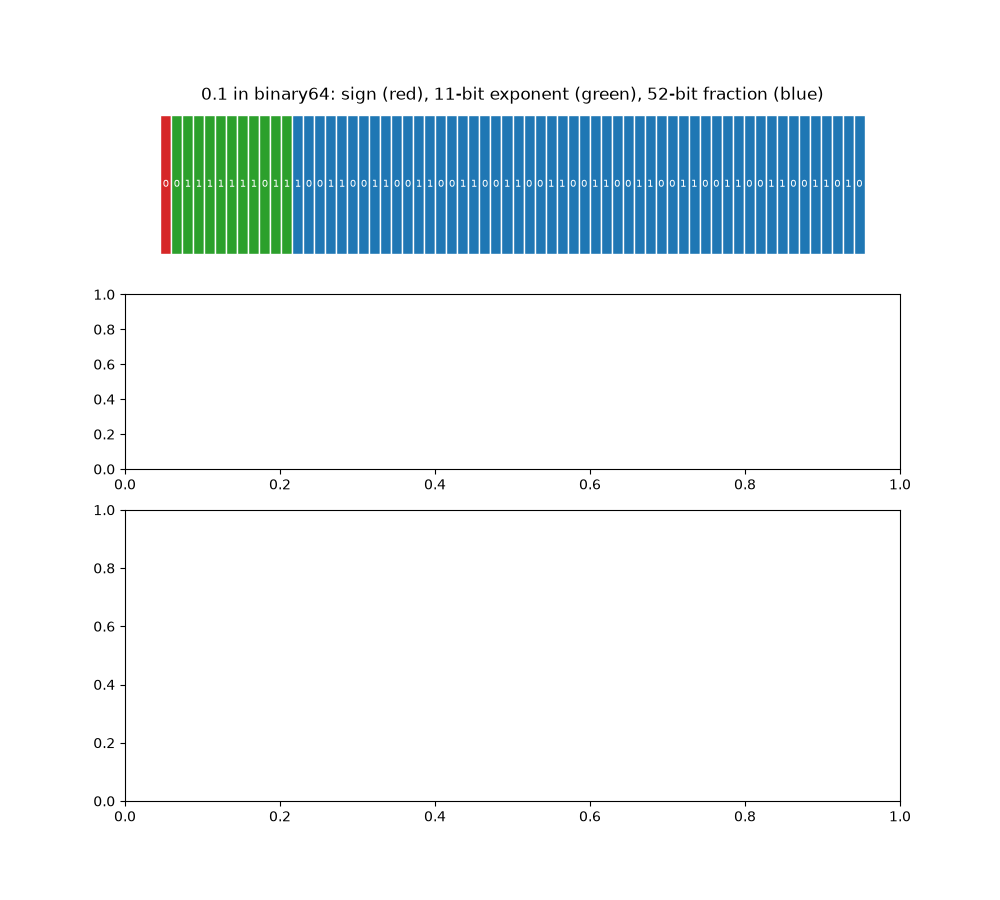
bits = float_bits(0.1)
word = str(bits.sign) + bits.exponent_bits + bits.fraction_bits
colors = ["tab:red"] + ["tab:green"] * 11 + ["tab:blue"] * 52
axes[0].bar(np.arange(64), 1, color=colors, edgecolor="white", width=1.0)
for i, ch in enumerate(word):
    axes[0].text(i, 0.5, ch, ha="center", va="center", color="white", fontsize=7)
axes[0].set_axis_off()
axes[0].set_title("0.1 in binary64: sign (red), 11-bit exponent (green), 52-bit fraction (blue)")
     1.0: sign 0 | exponent 01111111111 (2^0) | fraction 0000000000000000... | normal
     0.1: sign 0 | exponent 01111111011 (2^-4) | fraction 1001100110011001... | normal
    -2.5: sign 1 | exponent 10000000000 (2^1) | fraction 0100000000000000... | normal
  5e-324: sign 0 | exponent 00000000000 (2^-1022) | fraction 0000000000000000... | subnormal
 float16: machine epsilon 9.766e-04 = 2^-10
 float32: machine epsilon 1.192e-07 = 2^-23
 float64: machine epsilon 2.220e-16 = 2^-52

Text(0.5, 1.0, '0.1 in binary64: sign (red), 11-bit exponent (green), 52-bit fraction (blue)')
A toy floating-point system#
With a 3-bit significand every binade holds four numbers. Subnormals (orange) fill the gap between 0 and the smallest normal number evenly.
normal = toy_float_system(precision=3, emin=-1, emax=3)
with_sub = toy_float_system(precision=3, emin=-1, emax=3, subnormals=True)
subnormal = np.setdiff1d(with_sub, normal)
axes[1].plot(normal, np.zeros_like(normal), "|", ms=25, color="tab:blue", label="normal")
axes[1].plot(subnormal, np.zeros_like(subnormal), "|", ms=25, color="tab:orange", label="subnormal")
for e in range(-1, 4):
    axes[1].axvline(2.0 ** (e - 1), color="gray", lw=0.5, ls=":")
axes[1].set_yticks([])
axes[1].set_xlabel("x")
axes[1].set_title("t = 3, e in [-1, 3]: spacing doubles at every power of two")
axes[1].legend(loc="upper left")
<matplotlib.legend.Legend object at 0x112e6f620>
ulp(x) is a staircase that follows eps times abs(x)#
x = np.logspace(-3, 3, 2000)
for dtype, color in ((np.float32, "tab:purple"), (np.float64, "tab:blue")):
    axes[2].loglog(x, ulp(x, dtype), color=color, label=f"ulp(x), {np.dtype(dtype).name}")
    axes[2].loglog(x, machine_epsilon(dtype) * x, "--", color=color, lw=0.8, label=rf"$\varepsilon\,|x|$, {np.dtype(dtype).name}")
axes[2].set_xlabel("x")
axes[2].set_ylabel("gap to the next float")
axes[2].legend(fontsize=8)
fig.tight_layout()

plt.show()
Total running time of the script: (0 minutes 0.889 seconds)
