
Note
Go to the end to download the full example code or to run this example in your browser via JupyterLite.
Buffon’s needle: estimating pi by dropping needles#
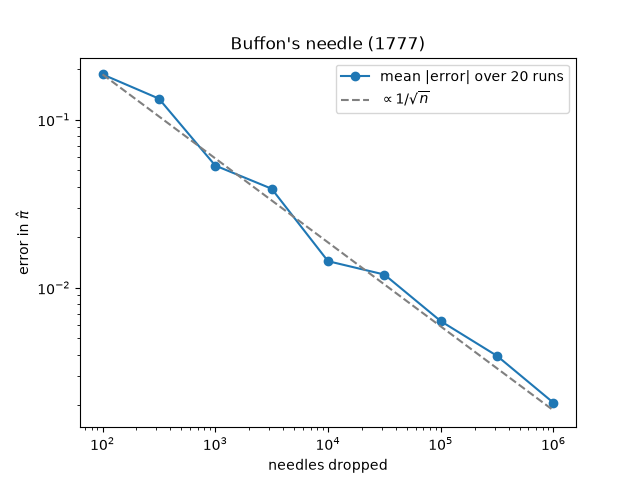
A needle as long as the gap between parallel lines crosses a line with probability \(2/\pi\), so counting crossings estimates \(\pi\). The estimate’s error shrinks like \(1/\sqrt{n}\).
import matplotlib.pyplot as plt
import numpy as np

from mathematicskit.probability import buffon_needle
One large experiment#
result = buffon_needle(n_drops=1000000, seed=0)
print(f"crossing fraction {result.crossing_fraction:.5f} (exact 2/pi = {result.exact_crossing_probability:.5f})")
print(f"pi estimate {result.pi_estimate:.5f}")
crossing fraction 0.63669 (exact 2/pi = 0.63662)
pi estimate 3.14125
Convergence with the number of drops#
n_values = np.logspace(2, 6, 9).astype(int)
errors = [np.mean([abs(buffon_needle(n, seed=s).pi_estimate - np.pi) for s in range(20)]) for n in n_values]

fig, ax = plt.subplots()
ax.loglog(n_values, errors, "o-", label="mean |error| over 20 runs")
ax.loglog(n_values, errors[0] * np.sqrt(n_values[0] / n_values), "--", color="0.5", label=r"$\propto 1/\sqrt{n}$")
ax.set_xlabel("needles dropped")
ax.set_ylabel(r"error in $\hat\pi$")
ax.legend()
ax.set_title("Buffon's needle (1777)")
Text(0.5, 1.0, "Buffon's needle (1777)")
Total running time of the script: (0 minutes 0.564 seconds)
