
Note
Go to the end to download the full example code or to run this example in your browser via JupyterLite.
Spearman’s rank correlation#
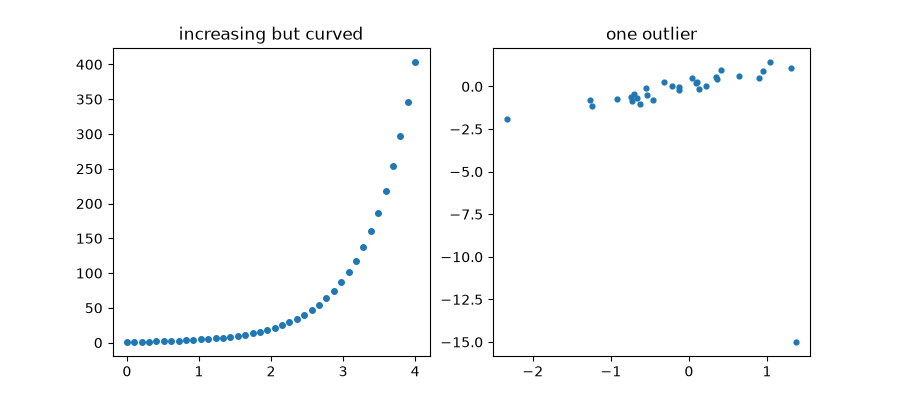
Spearman’s rho is Pearson’s r applied to ranks. It equals 1 for any increasing relationship, however curved, and a single wild outlier barely moves it, while Pearson’s r can swing a long way.
import matplotlib.pyplot as plt
import numpy as np

from mathematicskit.statistics import pearson_correlation, spearman_correlation
A monotone but curved relationship#
x = np.linspace(0.0, 4.0, 40)
y = np.exp(1.5 * x)
print(f"curved: Pearson r = {pearson_correlation(x, y).coefficient:.3f}, Spearman rho = {spearman_correlation(x, y).coefficient:.3f}")
curved: Pearson r = 0.814, Spearman rho = 1.000
Robustness to one outlier#
rng = np.random.default_rng(0)
a = rng.normal(size=30)
b = a + 0.3 * rng.normal(size=30)
b_outlier = b.copy()
b_outlier[np.argmax(a)] = -15.0
for label, yy in [("clean", b), ("one outlier", b_outlier)]:
    print(f"{label:12s}: Pearson r = {pearson_correlation(a, yy).coefficient:+.3f}, Spearman rho = {spearman_correlation(a, yy).coefficient:+.3f}")

fig, axes = plt.subplots(1, 2, figsize=(9, 4))
axes[0].plot(x, y, "o", ms=4)
axes[0].set_title("increasing but curved")
axes[1].scatter(a, b_outlier, s=12)
axes[1].set_title("one outlier")
clean       : Pearson r = +0.938, Spearman rho = +0.926
one outlier : Pearson r = -0.095, Spearman rho = +0.734

Text(0.5, 1.0, 'one outlier')
Total running time of the script: (0 minutes 0.035 seconds)
