
Note
Go to the end to download the full example code or to run this example in your browser via JupyterLite.
Descriptive statistics and the five-number summary#
Summarizes a skewed dataset (exponential-ish waiting times) and visualizes its five-number summary as a boxplot.
import numpy as np

from mathematicskit.statistics import descriptive_stats
from mathematicskit.statistics.visualizers.plots import plot_boxplot
Generate a right-skewed dataset and summarize it#
rng = np.random.default_rng(0)
data = rng.exponential(scale=3.0, size=500)
result = descriptive_stats(data)

print(f"n={result.n}, mean={result.mean:.3f}, std={result.std:.3f}")
print(f"skewness={result.skewness:.3f} (positive: right-skewed, as expected for an exponential)")
print(f"five-number summary: [{result.minimum:.2f}, {result.q1:.2f}, {result.median:.2f}, {result.q3:.2f}, {result.maximum:.2f}]")
n=500, mean=3.289, std=3.152
skewness=2.087 (positive: right-skewed, as expected for an exponential)
five-number summary: [0.00, 1.00, 2.39, 4.54, 24.39]
Visualize the five-number summary#
plot_boxplot(data, label="waiting times")
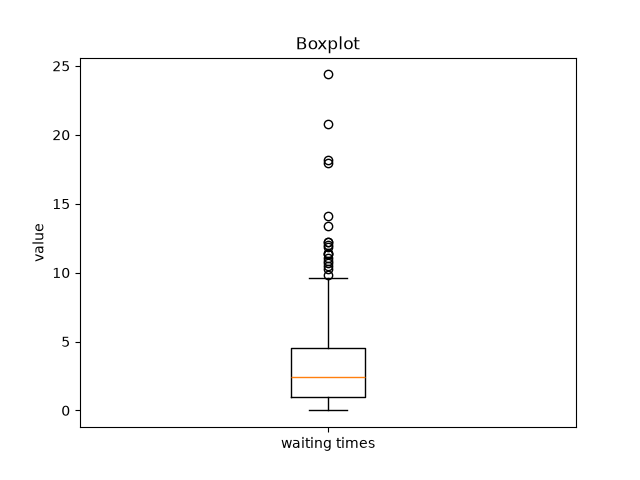
<Axes: title={'center': 'Boxplot'}, ylabel='value'>
Total running time of the script: (0 minutes 0.017 seconds)
