
Note
Go to the end to download the full example code or to run this example in your browser via JupyterLite.
Wilks’s theorem and the likelihood-ratio test#
Repeatedly tests the true null hypothesis “the normal mean is 0” with the likelihood-ratio statistic 2(l1 - l0). Wilks’s theorem says the statistic’s null distribution approaches chi-square with one degree of freedom, the number of parameters the null hypothesis fixes.
import matplotlib.pyplot as plt
import numpy as np
from scipy import stats

from mathematicskit.statistics import likelihood_ratio_test, maximum_likelihood_fit
Simulating the statistic under the null#
rng = np.random.default_rng(0)
statistics = []
for _ in range(1000):
    data = rng.normal(loc=0.0, scale=1.0, size=50)
    null = maximum_likelihood_fit(data, "norm", floc=0.0)
    alt = maximum_likelihood_fit(data, "norm")
    statistics.append(likelihood_ratio_test(null.log_likelihood, alt.log_likelihood, df=1).statistic)
statistics = np.array(statistics)
print(f"fraction above the chi2(1) 95% point: {np.mean(statistics > stats.chi2.ppf(0.95, 1)):.3f} (nominal 0.05)")

fig, ax = plt.subplots()
ax.hist(statistics, bins=40, density=True, alpha=0.6, label="simulated 2(l1 - l0)")
grid = np.linspace(0.05, 10, 200)
ax.plot(grid, stats.chi2.pdf(grid, 1), label=r"$\chi^2_1$ density")
ax.set_ylim(0, 1.5)
ax.legend()
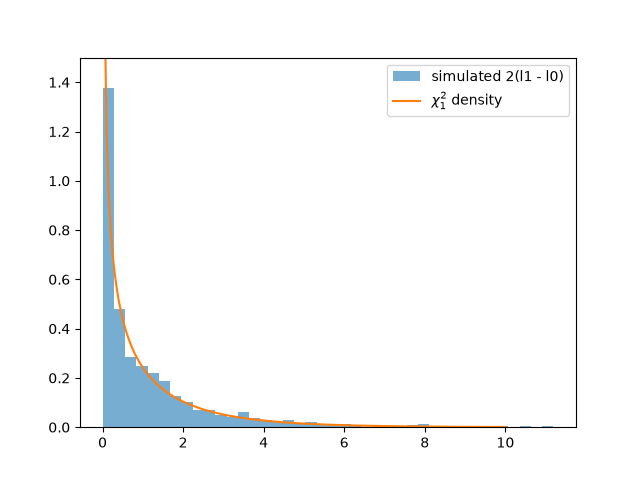
fraction above the chi2(1) 95% point: 0.066 (nominal 0.05)

<matplotlib.legend.Legend object at 0x121f16270>
Total running time of the script: (0 minutes 0.085 seconds)
