
Note
Go to the end to download the full example code or to run this example in your browser via JupyterLite.
Hopf’s Umlaufsatz: the turning number of a closed curve (1935)#
As you walk once around a closed plane curve, your heading turns by a whole number of full turns. Hopf proved that for every simple closed curve that number is \(\pm 1\). Curves that cross themselves can have any turning number: 0 for a figure eight, 2 for a limaçon with an inner loop, 4 for a circle carrying three small inner loops.
import matplotlib.pyplot as plt
import numpy as np

from mathematicskit.topology import turning_number

t = np.linspace(0, 2 * np.pi, 800, endpoint=False)
rng = np.random.default_rng(3)
radius = 1 + sum(rng.normal(0, 0.12) * np.cos(k * t + rng.uniform(0, 6)) for k in range(2, 7))
curves = {
    "ellipse": np.column_stack([2 * np.cos(t), np.sin(t)]),
    "random blob": radius[:, None] * np.column_stack([np.cos(t), np.sin(t)]),
    "blob, clockwise": (radius[:, None] * np.column_stack([np.cos(t), np.sin(t)]))[::-1],
    "figure eight": np.column_stack([np.sin(t), np.sin(2 * t)]),
    "limaçon": (0.5 + np.cos(t))[:, None] * np.column_stack([np.cos(t), np.sin(t)]),
    "three inner loops": np.column_stack([np.cos(t) + 0.6 * np.cos(4 * t), np.sin(t) + 0.6 * np.sin(4 * t)]),
}

fig, axes = plt.subplots(2, 3, figsize=(11, 7))
for ax, (name, c) in zip(axes.ravel(), curves.items(), strict=True):
    ax.plot(*np.vstack([c, c[:1]]).T, lw=1.5)
    # arrows show the direction of travel
    for i in range(0, len(c), len(c) // 6):
        d = c[(i + 3) % len(c)] - c[i]
        ax.annotate("", c[i] + d, c[i], arrowprops={"arrowstyle": "->", "color": "tab:red"})
    ax.set_title(f"{name}\nturning number {turning_number(c)}")
    ax.set_aspect("equal")
    ax.axis("off")
fig.suptitle("Hopf (1935): a simple closed curve turns exactly once")
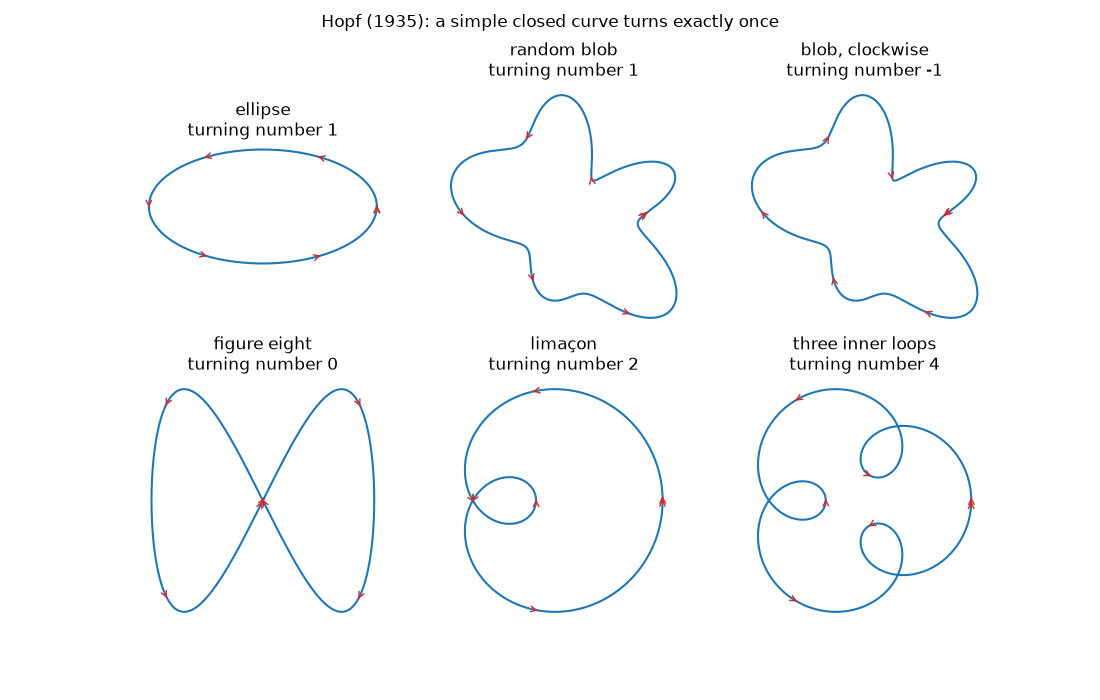
Text(0.5, 0.98, 'Hopf (1935): a simple closed curve turns exactly once')
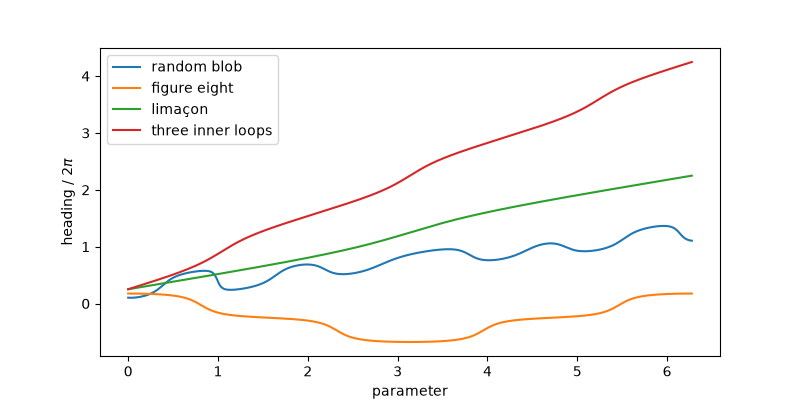
The tangent angle along the curve#
The unwrapped heading rises by \(2\pi\) per turn.
fig, ax = plt.subplots(figsize=(8, 4))
for name in ("random blob", "figure eight", "limaçon", "three inner loops"):
    c = curves[name]
    d = np.roll(c, -1, axis=0) - c
    ax.plot(t, np.unwrap(np.arctan2(d[:, 1], d[:, 0])) / (2 * np.pi), label=name)
ax.set_xlabel("parameter")
ax.set_ylabel("heading / $2\\pi$")
ax.legend()
<matplotlib.legend.Legend object at 0x1174d2660>
Total running time of the script: (0 minutes 0.091 seconds)
