
Note
Go to the end to download the full example code or to run this example in your browser via JupyterLite.
Persistent homology (Edelsbrunner, Letscher and Zomorodian 2002)#
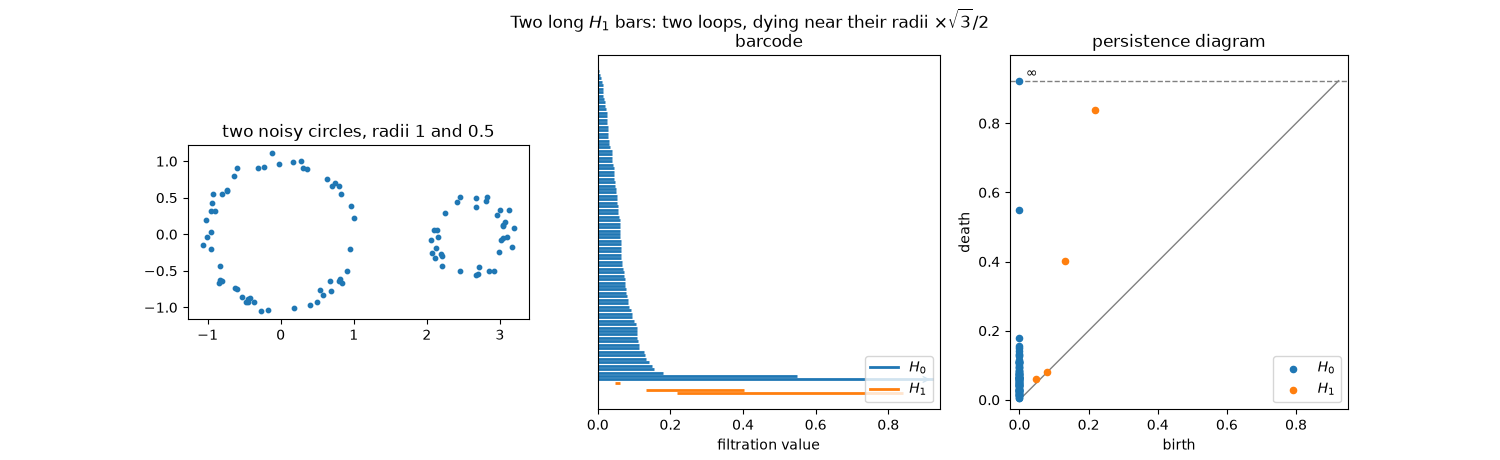
No single scale is right for a noisy sample, so persistent homology tracks all scales at once. As the radius grows, each homology class is born at some radius and dies at a larger one. One reduction of the filtration’s boundary matrix pairs every birth with its death. Short bars are noise. The long bars are the shape: two loops for this sample of two circles of different sizes, each dying when its disc fills in.
47360 simplices in the filtration
H_1 class born at r = 0.218, dies at r = 0.839, persistence 0.621
H_1 class born at r = 0.132, dies at r = 0.402, persistence 0.270
the other 2 H_1 classes persist at most 0.014

Text(0.5, 0.98, 'Two long $H_1$ bars: two loops, dying near their radii $\\times \\sqrt{3}/2$')
import matplotlib.pyplot as plt
import numpy as np

from mathematicskit.topology import persistent_homology, vietoris_rips_filtration
from mathematicskit.topology.visualizers import plot_barcode, plot_persistence_diagram

rng = np.random.default_rng(2)
t = rng.uniform(0, 2 * np.pi, 90)
points = np.vstack([np.column_stack([np.cos(t[:55]), np.sin(t[:55])]), np.column_stack([2.6 + 0.5 * np.cos(t[55:]), 0.5 * np.sin(t[55:])])])
points += rng.normal(0, 0.05, points.shape)

filtration = vietoris_rips_filtration(points, max_radius=1.2, max_dim=2)
diagram = persistent_homology(filtration, max_dim=1)
print(f"{len(filtration)} simplices in the filtration")
order = np.argsort(-diagram.persistence(1))
for birth, death in diagram.diagram(1)[order[:2]]:
    print(f"H_1 class born at r = {birth:.3f}, dies at r = {death:.3f}, persistence {death - birth:.3f}")
print(f"the other {len(order) - 2} H_1 classes persist at most {diagram.persistence(1)[order[2:]].max():.3f}")

fig, axes = plt.subplots(1, 3, figsize=(15, 4.6))
axes[0].scatter(*points.T, s=10)
axes[0].set_aspect("equal")
axes[0].set_title("two noisy circles, radii 1 and 0.5")
plot_barcode(diagram, ax=axes[1])
axes[1].set_title("barcode")
plot_persistence_diagram(diagram, ax=axes[2])
axes[2].set_title("persistence diagram")
fig.suptitle("Two long $H_1$ bars: two loops, dying near their radii $\\times \\sqrt{3}/2$")
Total running time of the script: (0 minutes 0.305 seconds)
