
Note
Go to the end to download the full example code or to run this example in your browser via JupyterLite.
Stability of persistence diagrams (Cohen-Steiner, Edelsbrunner and Harer 2007)#
Persistence is useful because it is stable. Change a function by at most \(\varepsilon\) everywhere, and its persistence diagram moves by at most \(\varepsilon\) in the bottleneck distance: \(d_B(\mathrm{Dgm} f, \mathrm{Dgm}\, g) \le \|f - g\|_\infty\). Noise creates new points, but only near the diagonal. Below, a signal’s sublevel-set diagram (its minima paired with the maxima that merge them) is compared with noisy copies at growing noise levels. The bottleneck distance always stays below the noise amplitude.
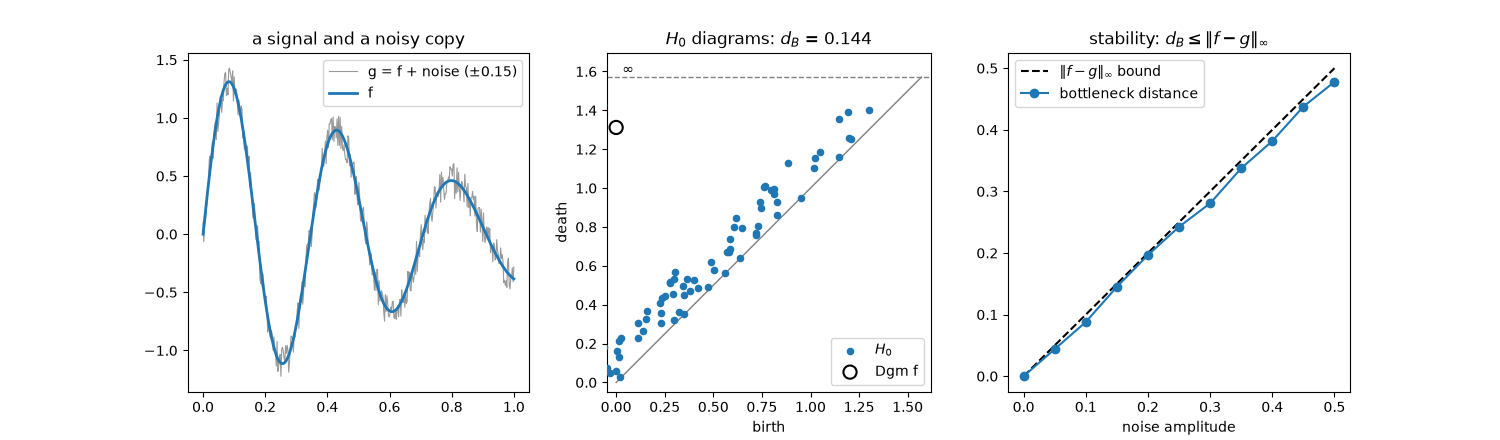
||f - g|| <= 0.00: d_B = 0.000
||f - g|| <= 0.05: d_B = 0.044
||f - g|| <= 0.10: d_B = 0.088
||f - g|| <= 0.15: d_B = 0.145
||f - g|| <= 0.20: d_B = 0.197
||f - g|| <= 0.25: d_B = 0.243
||f - g|| <= 0.30: d_B = 0.281
||f - g|| <= 0.35: d_B = 0.338
||f - g|| <= 0.40: d_B = 0.382
||f - g|| <= 0.45: d_B = 0.438
||f - g|| <= 0.50: d_B = 0.478

Text(0.5, 1.0, 'stability: $d_B \\leq \\|f - g\\|_\\infty$')
import matplotlib.pyplot as plt
import numpy as np

from mathematicskit.topology import SimplicialComplex, bottleneck_distance, lower_star_filtration, persistent_homology
from mathematicskit.topology.visualizers import plot_persistence_diagram

x = np.linspace(0, 1, 400)
f = np.sin(6 * np.pi * x) * (1 - x) + 0.4 * np.sin(17 * x)
path = SimplicialComplex([[i, i + 1] for i in range(len(x) - 1)])
diagram_f = persistent_homology(lower_star_filtration(path, f))

rng = np.random.default_rng(0)
amplitudes = np.linspace(0.0, 0.5, 11)
distances = []
for eps in amplitudes:
    g = f + rng.uniform(-eps, eps, len(x))
    d = bottleneck_distance(diagram_f.diagram(0), persistent_homology(lower_star_filtration(path, g)).diagram(0))
    distances.append(d)
    print(f"||f - g|| <= {eps:.2f}: d_B = {d:.3f}")

g = f + rng.uniform(-0.15, 0.15, len(x))
diagram_g = persistent_homology(lower_star_filtration(path, g))
fig, axes = plt.subplots(1, 3, figsize=(15, 4.4))
axes[0].plot(x, g, color="0.6", lw=0.8, label="g = f + noise (±0.15)")
axes[0].plot(x, f, lw=2, label="f")
axes[0].legend()
axes[0].set_title("a signal and a noisy copy")
plot_persistence_diagram(diagram_g, ax=axes[1], dims=[0])
d = diagram_f.diagram(0)
deaths = np.where(np.isinf(d[:, 1]), axes[1].get_ylim()[1] / 1.08, d[:, 1])
axes[1].scatter(d[:, 0], deaths, s=90, facecolors="none", edgecolors="k", linewidths=1.5, zorder=4, label="Dgm f")
axes[1].legend(loc="lower right")
axes[1].set_title(f"$H_0$ diagrams: $d_B$ = {bottleneck_distance(d, diagram_g.diagram(0)):.3f}")
axes[2].plot(amplitudes, amplitudes, "k--", label=r"$\|f - g\|_\infty$ bound")
axes[2].plot(amplitudes, distances, "o-", label="bottleneck distance")
axes[2].set_xlabel("noise amplitude")
axes[2].legend()
axes[2].set_title("stability: $d_B \\leq \\|f - g\\|_\\infty$")
Total running time of the script: (0 minutes 0.105 seconds)
