
Note
Go to the end to download the full example code or to run this example in your browser via JupyterLite.
Mapper (Singh, Mémoli and Carlsson 2007)#
Mapper summarizes a data set as a graph. Slice the data by a lens function, cluster each slice, and join clusters that share points. It is a discrete Reeb graph. Here 3-dimensional data sampled near a circle with a dangling branch are seen through their height. Mapper recovers one loop and one flare, and the graph’s Betti numbers \((1, 1)\) match the loop.
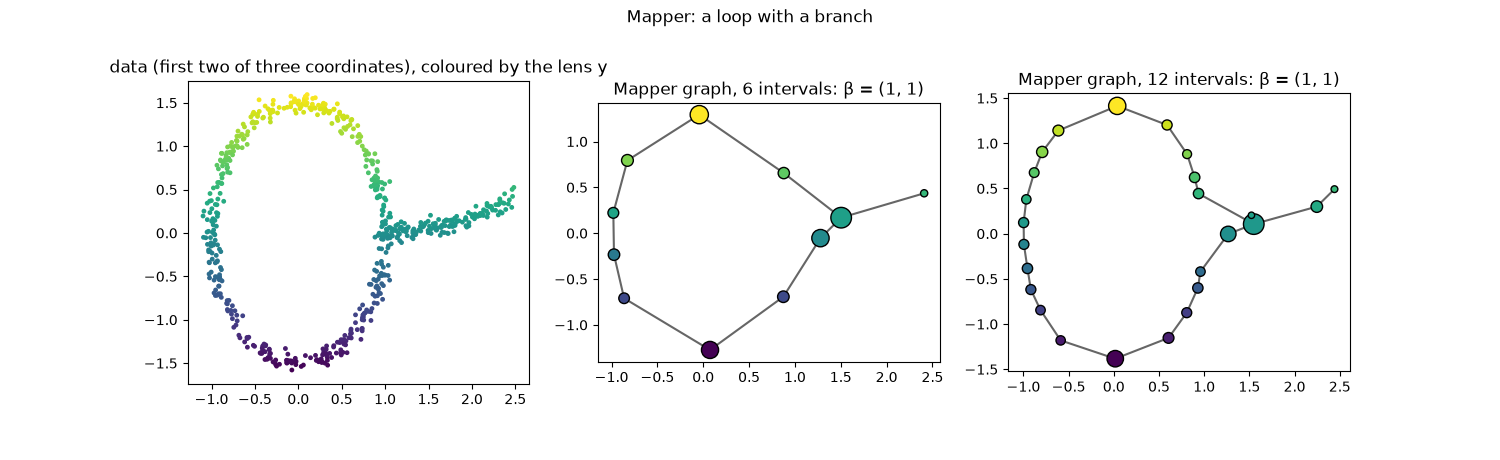
6 intervals: 11 nodes, 11 edges, Betti numbers (1, 1)
12 intervals: 25 nodes, 25 edges, Betti numbers (1, 1)

Text(0.5, 0.98, 'Mapper: a loop with a branch')
import matplotlib.pyplot as plt
import numpy as np

from mathematicskit.topology import betti_numbers, mapper_graph
from mathematicskit.topology.visualizers import plot_mapper_graph

rng = np.random.default_rng(5)
t = rng.uniform(0, 2 * np.pi, 500)
loop = np.column_stack([np.cos(t), 1.5 * np.sin(t), 0.3 * np.sin(2 * t)])
s = rng.uniform(0, 1, 150)
branch = np.column_stack([1 + 1.5 * s, 0.4 * s**2, 0 * s])
points = np.vstack([loop, branch]) + rng.normal(0, 0.05, (650, 3))

fig, axes = plt.subplots(1, 3, figsize=(15, 4.6))
axes[0].scatter(points[:, 0], points[:, 1], c=points[:, 1], s=6, cmap="viridis")
axes[0].set_aspect("equal")
axes[0].set_title("data (first two of three coordinates), coloured by the lens y")
for ax, n in zip(axes[1:], (6, 12), strict=True):
    result = mapper_graph(points, points[:, 1], eps=0.3, n_intervals=n, overlap=0.35)
    print(f"{n} intervals: {len(result.nodes)} nodes, {len(result.edges)} edges, Betti numbers {betti_numbers(result.graph)}")
    plot_mapper_graph(result, points, ax=ax)
    ax.set_title(f"Mapper graph, {n} intervals: β = {betti_numbers(result.graph)}")
fig.suptitle("Mapper: a loop with a branch")
Total running time of the script: (0 minutes 0.080 seconds)
