
Note
Go to the end to download the full example code or to run this example in your browser via JupyterLite.
Kahn-Marshall importance sampling#
Herman Kahn and Andy Marshall (1953), at RAND, wrote down the trick for shielding calculations in which almost no simulated neutron gets through: sample from a density that makes the rare event common, and reweight by the likelihood ratio. For normal drivers a mean shift \(\theta\) gives
\[E[f(Z)] = E_\theta\left[f(Z)\,e^{-\theta Z + \theta^2/2}\right].\]
A deep out-of-the-money call is such a rare event: shifting the normals so that the stock ends near the strike turns a handful of nonzero payoffs into thousands.
import matplotlib.pyplot as plt
import numpy as np

from financialkit.monte_carlo import european_option_mc, importance_sampling_normal, terminal_prices, vanilla_payoff
from financialkit.options import black_scholes_price

S, T, r, sigma = 100.0, 0.5, 0.03, 0.2
n = 20_000


def call(K):
    return lambda z: np.exp(-r * T) * vanilla_payoff(terminal_prices(S, T, r, sigma, z), K)


def strike_shift(K):
    """The normal that sends S_T to the strike."""
    return (np.log(K / S) - (r - 0.5 * sigma**2) * T) / (sigma * np.sqrt(T))
Relative error against moneyness#
strikes = np.array([100, 110, 120, 130, 140, 150, 160])
rel = {"crude": [], "importance sampling": []}
for K in strikes:
    exact = black_scholes_price(S, K, T, r, sigma)
    crude = european_option_mc(S, K, T, r, sigma, n_paths=n, rng=int(K))
    imp = importance_sampling_normal(call(K), n, shift=strike_shift(K), rng=int(K))
    rel["crude"].append(crude.std_error / exact)
    rel["importance sampling"].append(imp.std_error / exact)
    print(f"K = {K}: exact {exact:.5f}, crude {crude.estimate:.5f} +/- {crude.std_error:.5f}, IS {imp.estimate:.5f} +/- {imp.std_error:.5f}")

fig, axes = plt.subplots(1, 2, figsize=(12, 4))
for label, v in rel.items():
    axes[0].semilogy(strikes, v, "o-", label=label)
axes[0].set_xlabel("strike K")
axes[0].set_ylabel("relative standard error")
axes[0].legend()
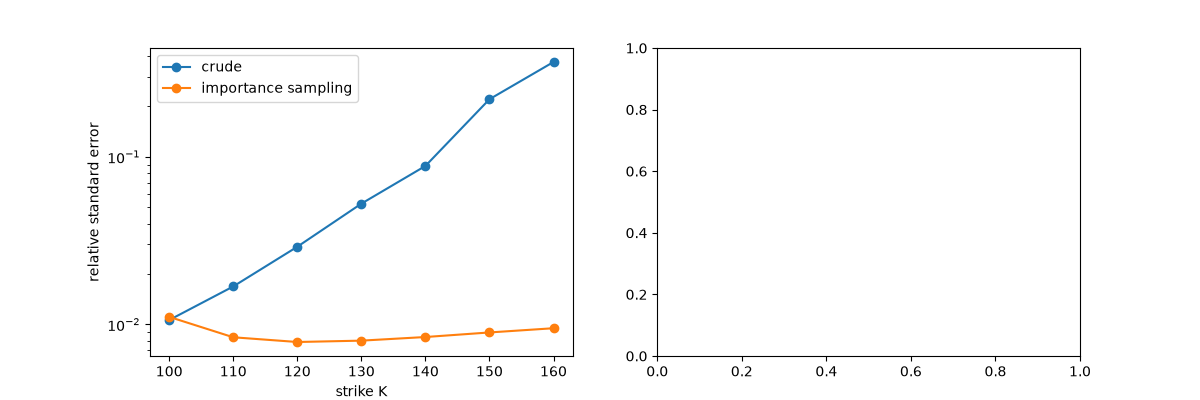
K = 100: exact 6.37103, crude 6.49128 +/- 0.06763, IS 6.49520 +/- 0.07062
K = 110: exact 2.61190, crude 2.52687 +/- 0.04399, IS 2.54746 +/- 0.02187
K = 120: exact 0.89140, crude 0.89649 +/- 0.02591, IS 0.88171 +/- 0.00700
K = 130: exact 0.25891, crude 0.25734 +/- 0.01361, IS 0.25684 +/- 0.00207
K = 140: exact 0.06563, crude 0.05366 +/- 0.00579, IS 0.06539 +/- 0.00055
K = 150: exact 0.01487, crude 0.01524 +/- 0.00328, IS 0.01496 +/- 0.00013
K = 160: exact 0.00308, crude 0.00239 +/- 0.00113, IS 0.00313 +/- 0.00003

<matplotlib.legend.Legend object at 0x111facad0>
The variance depends on the shift#
Too little shift leaves the event rare; too much makes the weights explode. The best shift is close to the strike’s normal score.
K = 150.0
shifts = np.linspace(0.0, 5.0, 21)
se = [importance_sampling_normal(call(K), n, shift=s, rng=1).std_error for s in shifts]
axes[1].semilogy(shifts, se, "o-")
axes[1].axvline(strike_shift(K), color="k", ls=":", label="shift to strike")
axes[1].set_xlabel(r"mean shift $\theta$")
axes[1].set_ylabel("standard error (K = 150)")
axes[1].legend()
fig.tight_layout()
plt.show()
Total running time of the script: (0 minutes 0.085 seconds)
