
Note
Go to the end to download the full example code or to run this example in your browser via JupyterLite.
Hammersley-Morton antithetic variates#
John Hammersley and Keith Morton (1956) proposed pairing each random input with its mirror image. If \(f\) is monotone, \(f(Z)\) and \(f(-Z)\) are negatively correlated and their average is less variable than two independent draws:
\[\operatorname{Var}\left[\tfrac12(f(Z) + f(-Z))\right] = \tfrac12\operatorname{Var} f(Z)\,(1 + \rho).\]
The same pairing applied to whole Brownian paths is
financialkit.integrators.antithetic_increments().
import matplotlib.pyplot as plt
import numpy as np

from financialkit.integrators import antithetic_increments, gbm_paths
from financialkit.monte_carlo import antithetic_estimate, sample_mean, terminal_prices

S, T, r, sigma = 100.0, 1.0, 0.05, 0.2
The gain depends on the payoff’s monotonicity#
A call is monotone in \(Z\) and gains; a straddle is nearly symmetric, so the pair is positively correlated and antithetics hurt.
strikes = np.linspace(70, 130, 13)
gain = {"call": [], "straddle": []}
for K in strikes:
    for name, payoff in [("call", lambda s, K=K: np.maximum(s - K, 0)), ("straddle", lambda s, K=K: np.abs(s - K))]:
        f = lambda z, p=payoff: np.exp(-r * T) * p(terminal_prices(S, T, r, sigma, z))  # noqa: E731
        crude = sample_mean(f(np.random.default_rng(0).standard_normal(20_000)))
        anti = antithetic_estimate(f, 10_000, rng=1)
        gain[name].append(anti.variance_ratio(crude))

fig, axes = plt.subplots(1, 2, figsize=(12, 4))
for name, g in gain.items():
    axes[0].plot(strikes, g, "o-", label=name)
axes[0].axhline(1.0, color="k", lw=1)
axes[0].set_xlabel("strike K")
axes[0].set_ylabel("variance reduction factor")
axes[0].legend()
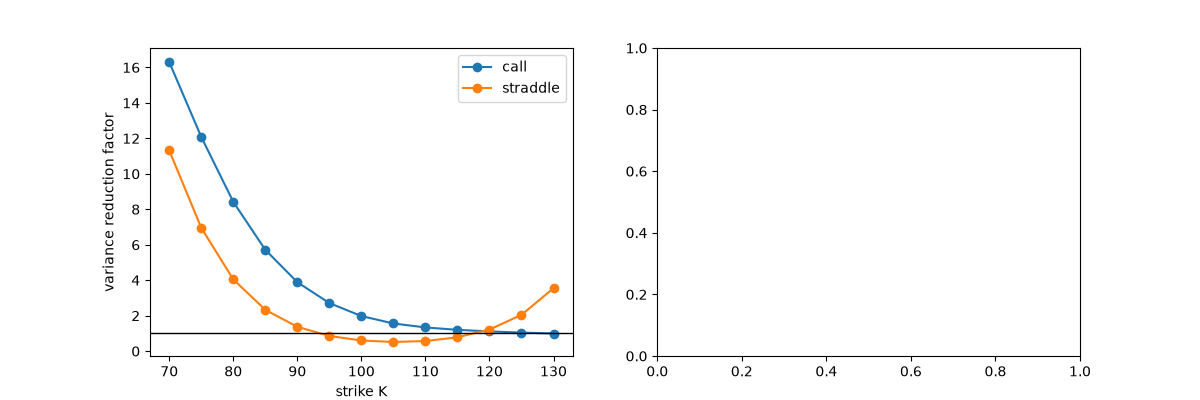
<matplotlib.legend.Legend object at 0x112237cb0>
Antithetic Brownian paths#
An Asian call on 12 monthly averages, priced from mirrored paths.
dW = antithetic_increments(T, 12, 20_000, rng=2)
_, paths = gbm_paths(S, r, sigma, T, 12, 20_000, dW=dW)
pay = np.exp(-r * T) * np.maximum(paths[:, 1:].mean(axis=1) - 100.0, 0)
pairs = sample_mean(0.5 * (pay[:10_000] + pay[10_000:]), n_evaluations=20_000)
_, ind = gbm_paths(S, r, sigma, T, 12, 20_000, rng=3)
crude = sample_mean(np.exp(-r * T) * np.maximum(ind[:, 1:].mean(axis=1) - 100.0, 0))
print(f"Asian call: crude {crude.estimate:.4f} +/- {crude.std_error:.4f}, antithetic {pairs.estimate:.4f} +/- {pairs.std_error:.4f}")
axes[1].plot(paths[0], label="path")
axes[1].plot(paths[10_000], label="its antithetic mirror")
axes[1].set_xlabel("month")
axes[1].set_ylabel("S")
axes[1].legend()
axes[1].set_title(f"Asian call: variance reduction x{pairs.variance_ratio(crude):.1f}")
fig.tight_layout()
plt.show()
Asian call: crude 6.1235 +/- 0.0599, antithetic 6.1736 +/- 0.0419
Total running time of the script: (0 minutes 0.074 seconds)
