
Note
Go to the end to download the full example code or to run this example in your browser via JupyterLite.
The Barone-Adesi-Whaley approximation#
Giovanni Barone-Adesi and Robert Whaley (1987), building on MacMillan (1986), found an almost closed-form American price. The early-exercise premium solves the Black-Scholes PDE; dropping one small time-derivative term leaves an ordinary differential equation with power-law solutions, and smooth pasting at a critical price \(S^*\) pins down the coefficient. One scalar root replaces a whole lattice.
Accuracy and speed against a 2000-step tree#
spots = np.linspace(70, 130, 13)
t0 = time.perf_counter()
baw = np.array([barone_adesi_whaley(s, K, T, r, sigma, option_type="put").price for s in spots])
t_baw = time.perf_counter() - t0
t0 = time.perf_counter()
tree = np.array([CRRTree(2000).price(s, K, T, r, sigma, option_type="put", american=True).price for s in spots])
t_tree = time.perf_counter() - t0
print(f"max |BAW - tree| = {np.max(np.abs(baw - tree)):.4f}; time {t_baw * 1e3:.1f} ms vs {t_tree * 1e3:.0f} ms")

res = barone_adesi_whaley(100.0, K, T, r, sigma, option_type="put")
print(f"at S = 100: American {res.price:.4f}, European {res.european_price:.4f}, critical price {res.critical_price:.2f}")

fig, axes = plt.subplots(1, 2, figsize=(11, 4))
axes[0].plot(spots, baw - tree, "o-")
axes[0].axhline(0, color="k", lw=0.5)
axes[0].set_xlabel("spot S")
axes[0].set_ylabel("BAW - tree")
axes[0].set_title("American put, 6 months")
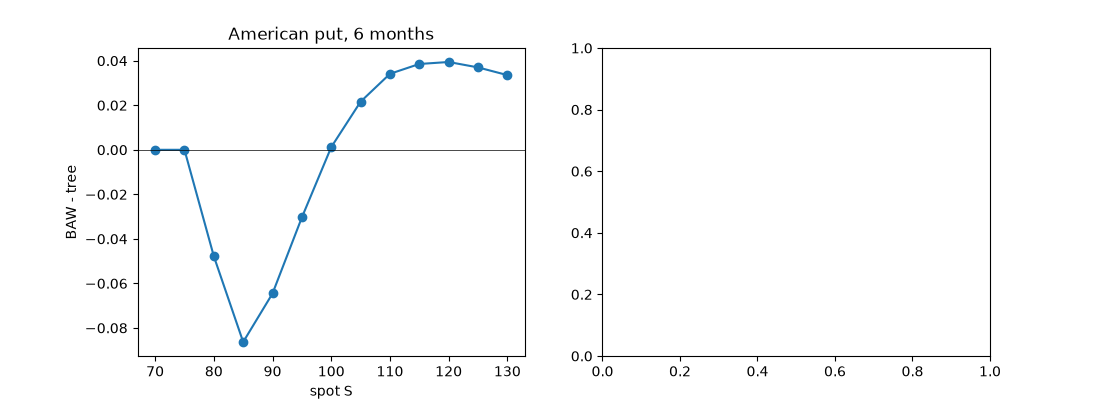
max |BAW - tree| = 0.0863; time 8.3 ms vs 424 ms
at S = 100: American 6.8670, European 6.4671, critical price 78.65

Text(0.5, 1.0, 'American put, 6 months')
The critical price across maturities#
maturities = np.linspace(0.02, 3.0, 40)
put_crit = [barone_adesi_whaley(100.0, K, t, r, sigma, option_type="put").critical_price for t in maturities]
call_crit = [barone_adesi_whaley(100.0, K, t, r, sigma, q=0.10).critical_price for t in maturities]
axes[1].plot(maturities, put_crit, label="put: exercise below")
axes[1].plot(maturities, call_crit, label="call with q = 10%: exercise above")
axes[1].axhline(K, color="k", lw=0.5)
axes[1].set_xlabel("time to expiry")
axes[1].set_ylabel("critical price")
axes[1].legend()
fig.tight_layout()

plt.show()
Total running time of the script: (0 minutes 0.539 seconds)
