Note
Go to the end to download the full example code or to run this example in your browser via JupyterLite.
Von Wachter et al.: wash trading in NFT markets (2022)#
A wash trade is a sale between parties who are really one. On NFT markets it fakes a price history for a token, or earns trading rewards: in early 2022 LooksRare paid its token to traders in proportion to their volume, and most of its volume was washed. Von Wachter, Jensen, Regner and Ross looked for the shape such trading leaves on a public ledger: a token that passes through a few accounts and returns to one that held it. A cycle of \(\ell\) sales among \(a_1, \dots, a_\ell\),
changes no one’s holdings, only the volume. Honest collectors rarely buy back a token after only a few sales, so short cycles are suspicious, and the accounts on them form rings.
import matplotlib.pyplot as plt

import blockchainkit as bk
A market with one ring#
history = bk.fraud.simulate_nft_market(
    tokens=50, traders=1_000, honest_trades=400, ring_size=3, wash_rounds=20, seed=4
)
report = bk.fraud.find_wash_trades(history.trades)
caught = history.wash & set(report.suspicious)
false_alarms = set(report.suspicious) - history.wash
print(f"{len(caught)} of {len(history.wash)} wash trades flagged, {len(false_alarms)} false alarms")
print("rings:", [sorted(ring) for ring in report.rings])
print(f"share of the traded value that was washed: {report.volume_share:.0%}")
assert caught == history.wash and report.volume_share > 0.8

fig, ax = plt.subplots(figsize=(9, 4))
for index, trade in enumerate(history.trades):
    washed = index in history.wash
    ax.scatter(index, trade.price, s=12, color="#dc2626" if washed else "#94a3b8")
ax.set(xlabel="trade", ylabel="price", yscale="log")
ax.set_title("60 wash trades (red) carry most of the volume")
fig.tight_layout()
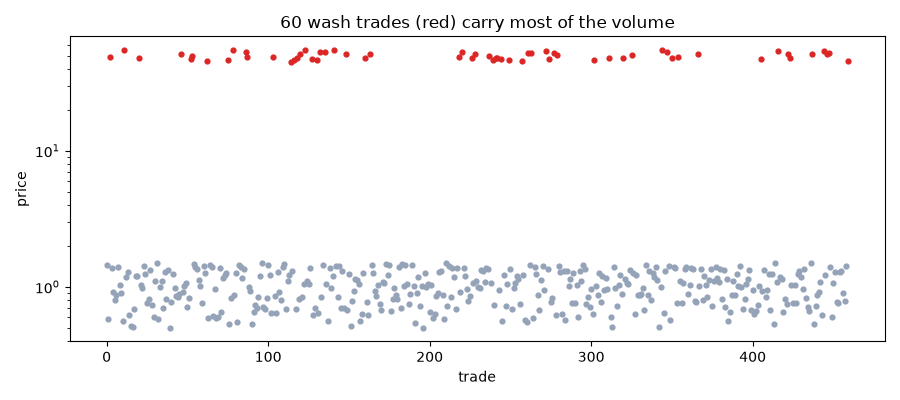
60 of 60 wash trades flagged, 0 false alarms
rings: [['ring0', 'ring1', 'ring2']]
share of the traded value that was washed: 88%
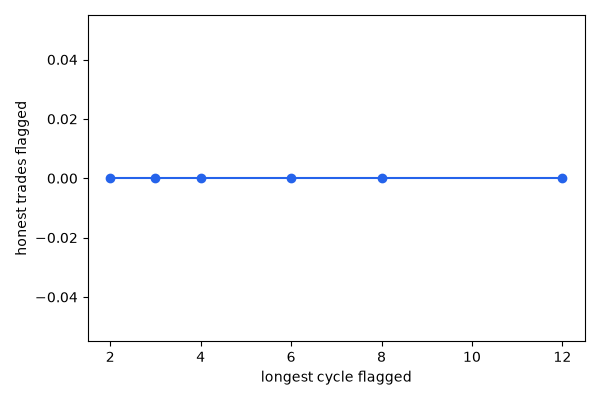
Longer cycles catch more, honest ones included#
lengths = [2, 3, 4, 6, 8, 12]
alarms = [
    len(set(bk.fraud.find_wash_trades(history.trades, max_length=n).suspicious) - history.wash)
    for n in lengths
]
assert alarms == sorted(alarms)

fig, ax = plt.subplots(figsize=(6, 4))
ax.plot(lengths, alarms, "o-", color="#2563eb")
ax.set(xlabel="longest cycle flagged", ylabel="honest trades flagged")
fig.tight_layout()

plt.show()
Exercise#
A wash trader can break the cycle by selling to a fresh account each time. What else, visible on chain, ties those accounts together? Von Wachter et al. looked at where each account’s first ether came from.
Total running time of the script: (0 minutes 0.407 seconds)
