
Note
Go to the end to download the full example code or to run this example in your browser via JupyterLite.
Xu and Livshits: the anatomy of a cryptocurrency pump-and-dump (2019)#
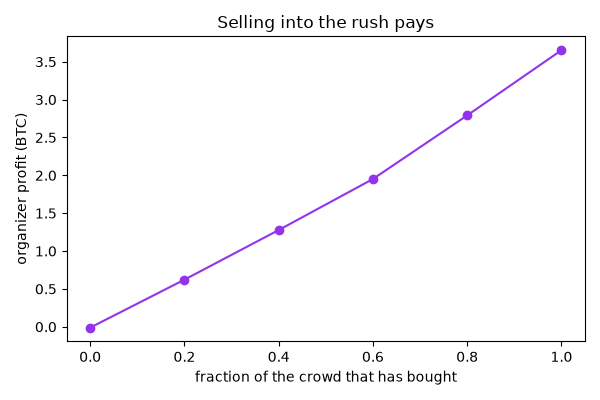
Telegram groups with tens of thousands of members announce a coin at a set minute; members rush to buy it, and the price jumps within seconds. The organizers bought it quietly beforehand, and sell into the rush. Xu and Livshits studied 412 such pumps from 2018 and 2019, and predicted which coin would be pumped from its market’s features. On a constant-product market the organizers’ advantage is arithmetic: each buyer of \(\Delta y\) gets \(x \Delta y / (y + \Delta y)\) coins at a higher price than the one before, so those who buy first and sell first win what the late buyers lose,
Pumps leave a trace in the public price and volume: a spike in both, far above their recent averages.
import matplotlib.pyplot as plt

import blockchainkit as bk
from blockchainkit.fraud.visualizers import plot_price_spikes
One pump, hour by hour#
run = bk.fraud.simulate_pump_and_dump(hours=48, pump_hour=24, participants=40, seed=1)
print(f"organizers made {run.organizer_profit:+.2f} BTC")
print(f"{run.losing_participants} of {len(run.participant_profits)} participants lost money")
flagged = bk.fraud.detect_pumps(run.prices, run.volumes)
print("hours flagged:", flagged)
assert run.organizer_profit > 0 and run.losing_participants > 20
assert flagged == (run.pump_hour,)

fig, axes = plt.subplots(1, 2, figsize=(11, 4))
plot_price_spikes(run.prices, flagged, ax=axes[0])
axes[0].set(xlabel="hour", title="Price spike at the announcement")
axes[1].bar(range(len(run.participant_profits)), run.participant_profits, color="#dc2626")
axes[1].axhline(0, color="black", linewidth=0.8)
axes[1].set(xlabel="participant", ylabel="profit (BTC)")
axes[1].set_title("Most of the crowd pays for the organizers")
fig.tight_layout()
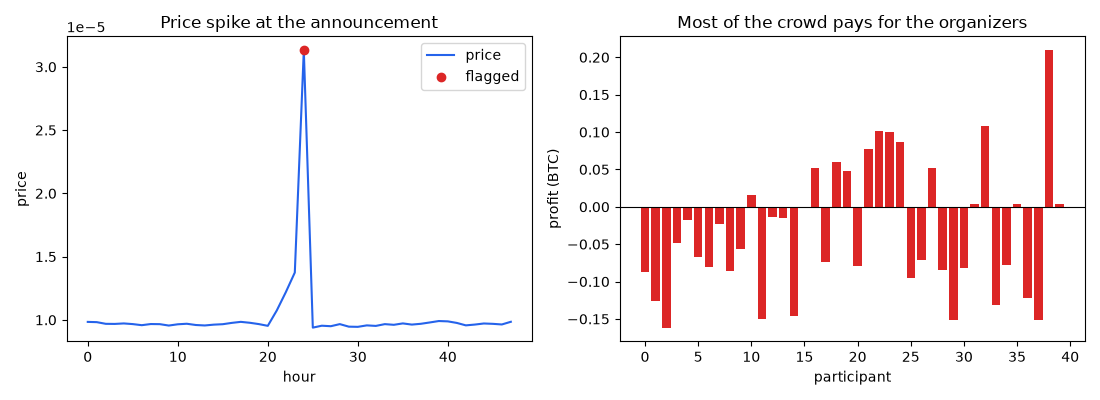
organizers made +1.28 BTC
26 of 40 participants lost money
hours flagged: (24,)
When the organizers dump#
timings = [0.0, 0.2, 0.4, 0.6, 0.8, 1.0]
profits = [bk.fraud.simulate_pump_and_dump(dump_after=t, seed=1).organizer_profit for t in timings]
assert profits[0] < profits[2]

fig, ax = plt.subplots(figsize=(6, 4))
ax.plot(timings, profits, "o-", color="#9333ea")
ax.set(xlabel="fraction of the crowd that has bought", ylabel="organizer profit (BTC)")
ax.set_title("Selling into the rush pays")
fig.tight_layout()

plt.show()
Exercise#
Lower window and volume_ratio in
detect_pumps() until hours
without a pump are flagged too. How would you choose the thresholds when
watching hundreds of coins at once?
Total running time of the script: (0 minutes 0.095 seconds)
