
Note
Go to the end to download the full example code or to run this example in your browser via JupyterLite.
Gandal et al.: price manipulation in the Bitcoin ecosystem, the Willy bot (2018)#
Between February and November 2013, two accounts on Mt. Gox, later dubbed the Markus and Willy bots, bought about 600,000 bitcoins without paying for them: the exchange credited them with dollars it did not have. Over the same months the price of bitcoin rose from about 150 to over 1,000 dollars. Gandal, Hamrick, Moore and Oberman compared the price change on the days the bots traded with the other days and found it rose about 4% a day on the former and fell slightly on the latter. In a thin market, buying moves the price: with Kyle’s linear impact \(\lambda\),
so a buyer of \(q_t\) who need not pay raises the price at will, and the rise appears only on the days it trades.
import matplotlib.pyplot as plt

import blockchainkit as bk
from blockchainkit.fraud.visualizers import plot_price_spikes
A year of trading, with a bot on one day in four#
days = 300
bot_days = set(range(40, 260, 4))
run = bk.fraud.simulate_bot_market(days, bot_days, bot_volume=1.0, impact=0.04, seed=2013)
honest = bk.fraud.simulate_bot_market(days, (), seed=2013)
flagged, other = bk.fraud.return_by_activity(run.prices, run.flagged)
print(f"mean daily return with the bot {flagged:+.2%}, without {other:+.2%}")
print(
    f"price: {run.prices[0]:.0f} -> {run.prices[-1]:.0f}, without the bot {honest.prices[-1]:.0f}"
)
assert flagged > 0.02 > abs(other)
assert run.prices[-1] > 5 * honest.prices[-1]

fig, ax = plt.subplots(figsize=(9, 4))
plot_price_spikes(run.prices, sorted(bot_days), ax=ax)
ax.plot(honest.prices, color="#94a3b8", label="same noise, no bot")
ax.set(xlabel="day", yscale="log", title="The rise happens on the bot's days")
ax.legend()
fig.tight_layout()

plt.show()
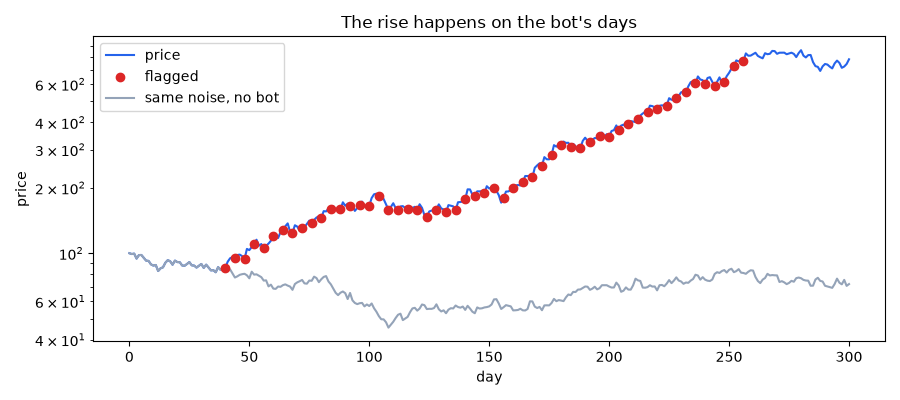
mean daily return with the bot +5.27%, without -0.34%
price: 100 -> 780, without the bot 72
Exercise#
The comparison of returns on flagged and other days needs to know which days the bot traded. Gandal et al. had the leaked Mt. Gox trade records. What could an outsider who sees only the daily price and volume test instead, and why is it weaker?
Total running time of the script: (0 minutes 0.053 seconds)
