
Note
Go to the end to download the full example code or to run this example in your browser via JupyterLite.
Ponzi’s scheme: paying old investors with new money (1920)#
In 1920 Charles Ponzi promised Boston investors 50% in 45 days, supposedly from arbitrage on international reply coupons. There was no arbitrage: each payout came from later deposits. Such a scheme pays its promises only while new money grows fast enough. A deposit \(D\) made \(\tau\) periods ago is owed \((1 + r) D\) today; if deposits grow by \(g\) per period and the operator keeps a fraction \(s\) of each, the scheme keeps up exactly when
For Ponzi’s terms, deposits must grow by half every 45 days. No population of investors grows like that for long: once growth slows, the payout outruns the cash, and the latest investors lose everything they paid in.
import matplotlib.pyplot as plt

import blockchainkit as bk
from blockchainkit.fraud.visualizers import plot_ponzi
Growth that cannot last#
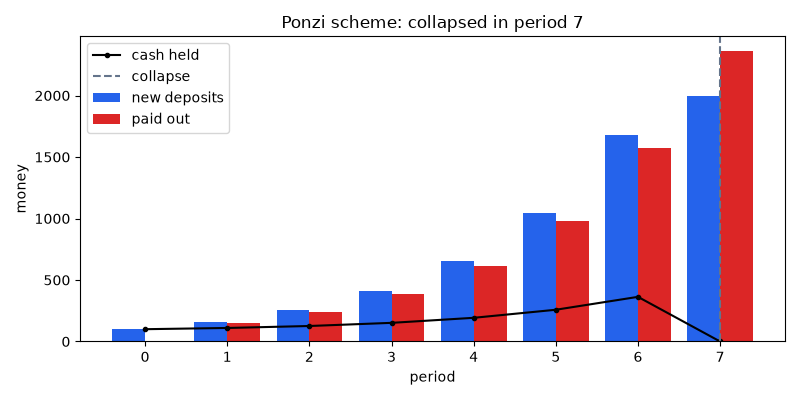
Deposits grow by 60% a period, faster than the breakeven 50%, until the pool of new investors saturates at 20 times the first period’s money.
needed = bk.fraud.breakeven_growth(0.5, term=1)
print(f"breakeven growth: {needed:.0%} per 45 days")
deposits = [min(100 * 1.6**t, 2_000) for t in range(15)]
run = bk.fraud.simulate_ponzi(deposits, promised_return=0.5, term=1)
print("collapsed in period", run.collapse, f"after raising {run.raised:,.0f}")
print(f"still owed to investors: {run.owed[-1]:,.0f}")
assert run.collapse is not None and run.owed[-1] > 2_000

fig, ax = plt.subplots(figsize=(8, 4))
plot_ponzi(run, ax=ax)
fig.tight_layout()
breakeven growth: 50% per 45 days
collapsed in period 7 after raising 6,307
still owed to investors: 3,154
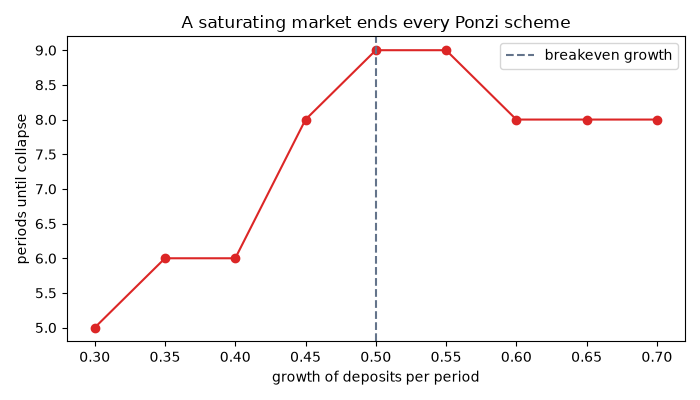
When it collapses, against how fast deposits grow#
growths = [0.3 + 0.05 * k for k in range(9)]
lifetimes = []
for g in growths:
    flows = [min(100 * (1 + g) ** t, 2_000) for t in range(40)]
    result = bk.fraud.simulate_ponzi(flows, promised_return=0.5)
    lifetimes.append(len(result.deposits))
assert lifetimes[0] < lifetimes[-1] < 40  # Faster growth only postpones the end.

fig, ax = plt.subplots(figsize=(7, 4))
ax.plot(growths, lifetimes, "o-", color="#dc2626")
ax.axvline(needed, color="#64748b", linestyle="--", label="breakeven growth")
ax.set(xlabel="growth of deposits per period", ylabel="periods until collapse")
ax.set_title("A saturating market ends every Ponzi scheme")
ax.legend()
fig.tight_layout()

plt.show()
Exercise#
Ponzi kept part of every deposit for himself. How fast must deposits grow
for a scheme promising 50% in 45 days if the operator skims 20%? Check
your answer with breakeven_growth().
A worked solution is in Exercises: fraud.
Total running time of the script: (0 minutes 0.075 seconds)
