
Note
Go to the end to download the full example code or to run this example in your browser via JupyterLite.
Difficulty retargeting: keeping ten-minute blocks (Bitcoin 2009)#
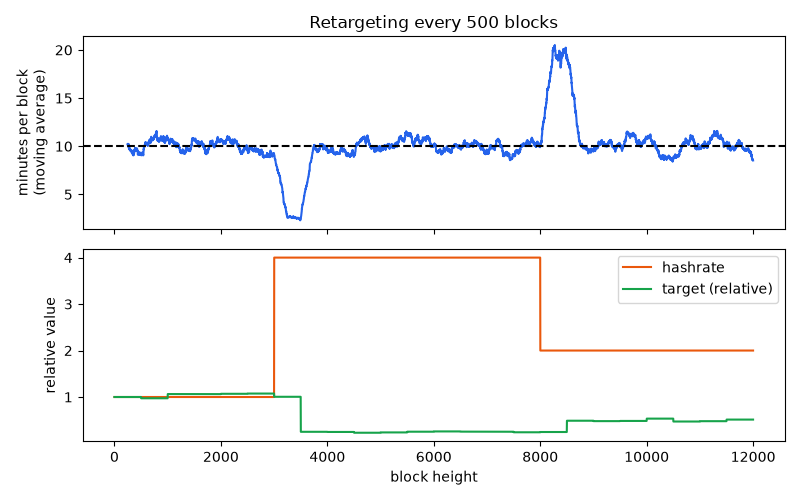
Proof of work is only a clock if its speed is controlled. Bitcoin adjusts its target every 2016 blocks by the ratio of the actual to the expected time, clamped to a factor of four, so blocks return to ten minutes after hashrate rises or falls.
When the hashrate quadruples, blocks come every 2.5 minutes until the next retarget, which lowers the target and restores the interval. The clamp limits how far one adjustment can go.
import matplotlib.pyplot as plt
import numpy as np

import blockchainkit as bk
A hashrate jump#
blocks = np.arange(len(hashrates))
# Average over 250-block windows, plotted at each window's last block (no edge padding).
window_means = np.convolve(run.block_times, np.ones(250) / 250, mode="valid")
fig, (top, bottom) = plt.subplots(2, 1, figsize=(8, 5), sharex=True)
top.plot(blocks[249:], window_means / 60, color="#2563eb")
top.axhline(10, color="black", linestyle="--")
top.set(ylabel="minutes per block\n(moving average)", title="Retargeting every 500 blocks")
bottom.plot(blocks, hashrates, color="#ea580c", label="hashrate")
bottom.plot(
    blocks, np.array(run.targets) / run.targets[0], color="#16a34a", label="target (relative)"
)
bottom.set(xlabel="block height", ylabel="relative value")
bottom.legend()
fig.tight_layout()

plt.show()
Exercise#
Bitcoin’s original code measured 2015 intervals for 2016 blocks, an off-by-one. Estimate the effect on the long-run average block time.
A worked solution is in Exercises: consensus.
Total running time of the script: (0 minutes 0.098 seconds)
